Education


American politicians, and Americans themselves, love to call themselves “a nation of immigrants”: a place where everyone’s family has, at some point, chosen to come to seek freedom or a better life. America has managed to maintain that self-image through the forced migration of millions of African slaves, restrictive immigration laws based on fears of “inferior” races, and nativist movements that encouraged immigrants to assimilate or simply leave.

But while the reality of America’s immigrant heritage is more complicated than the myth, it’s still a fundamental truth of the country’s history. It’s impossible to understand the country today without knowing who’s been kept out, who’s been let in, and how they’ve been treated once they arrive.


Where we come from

  1. We’re all immigrants

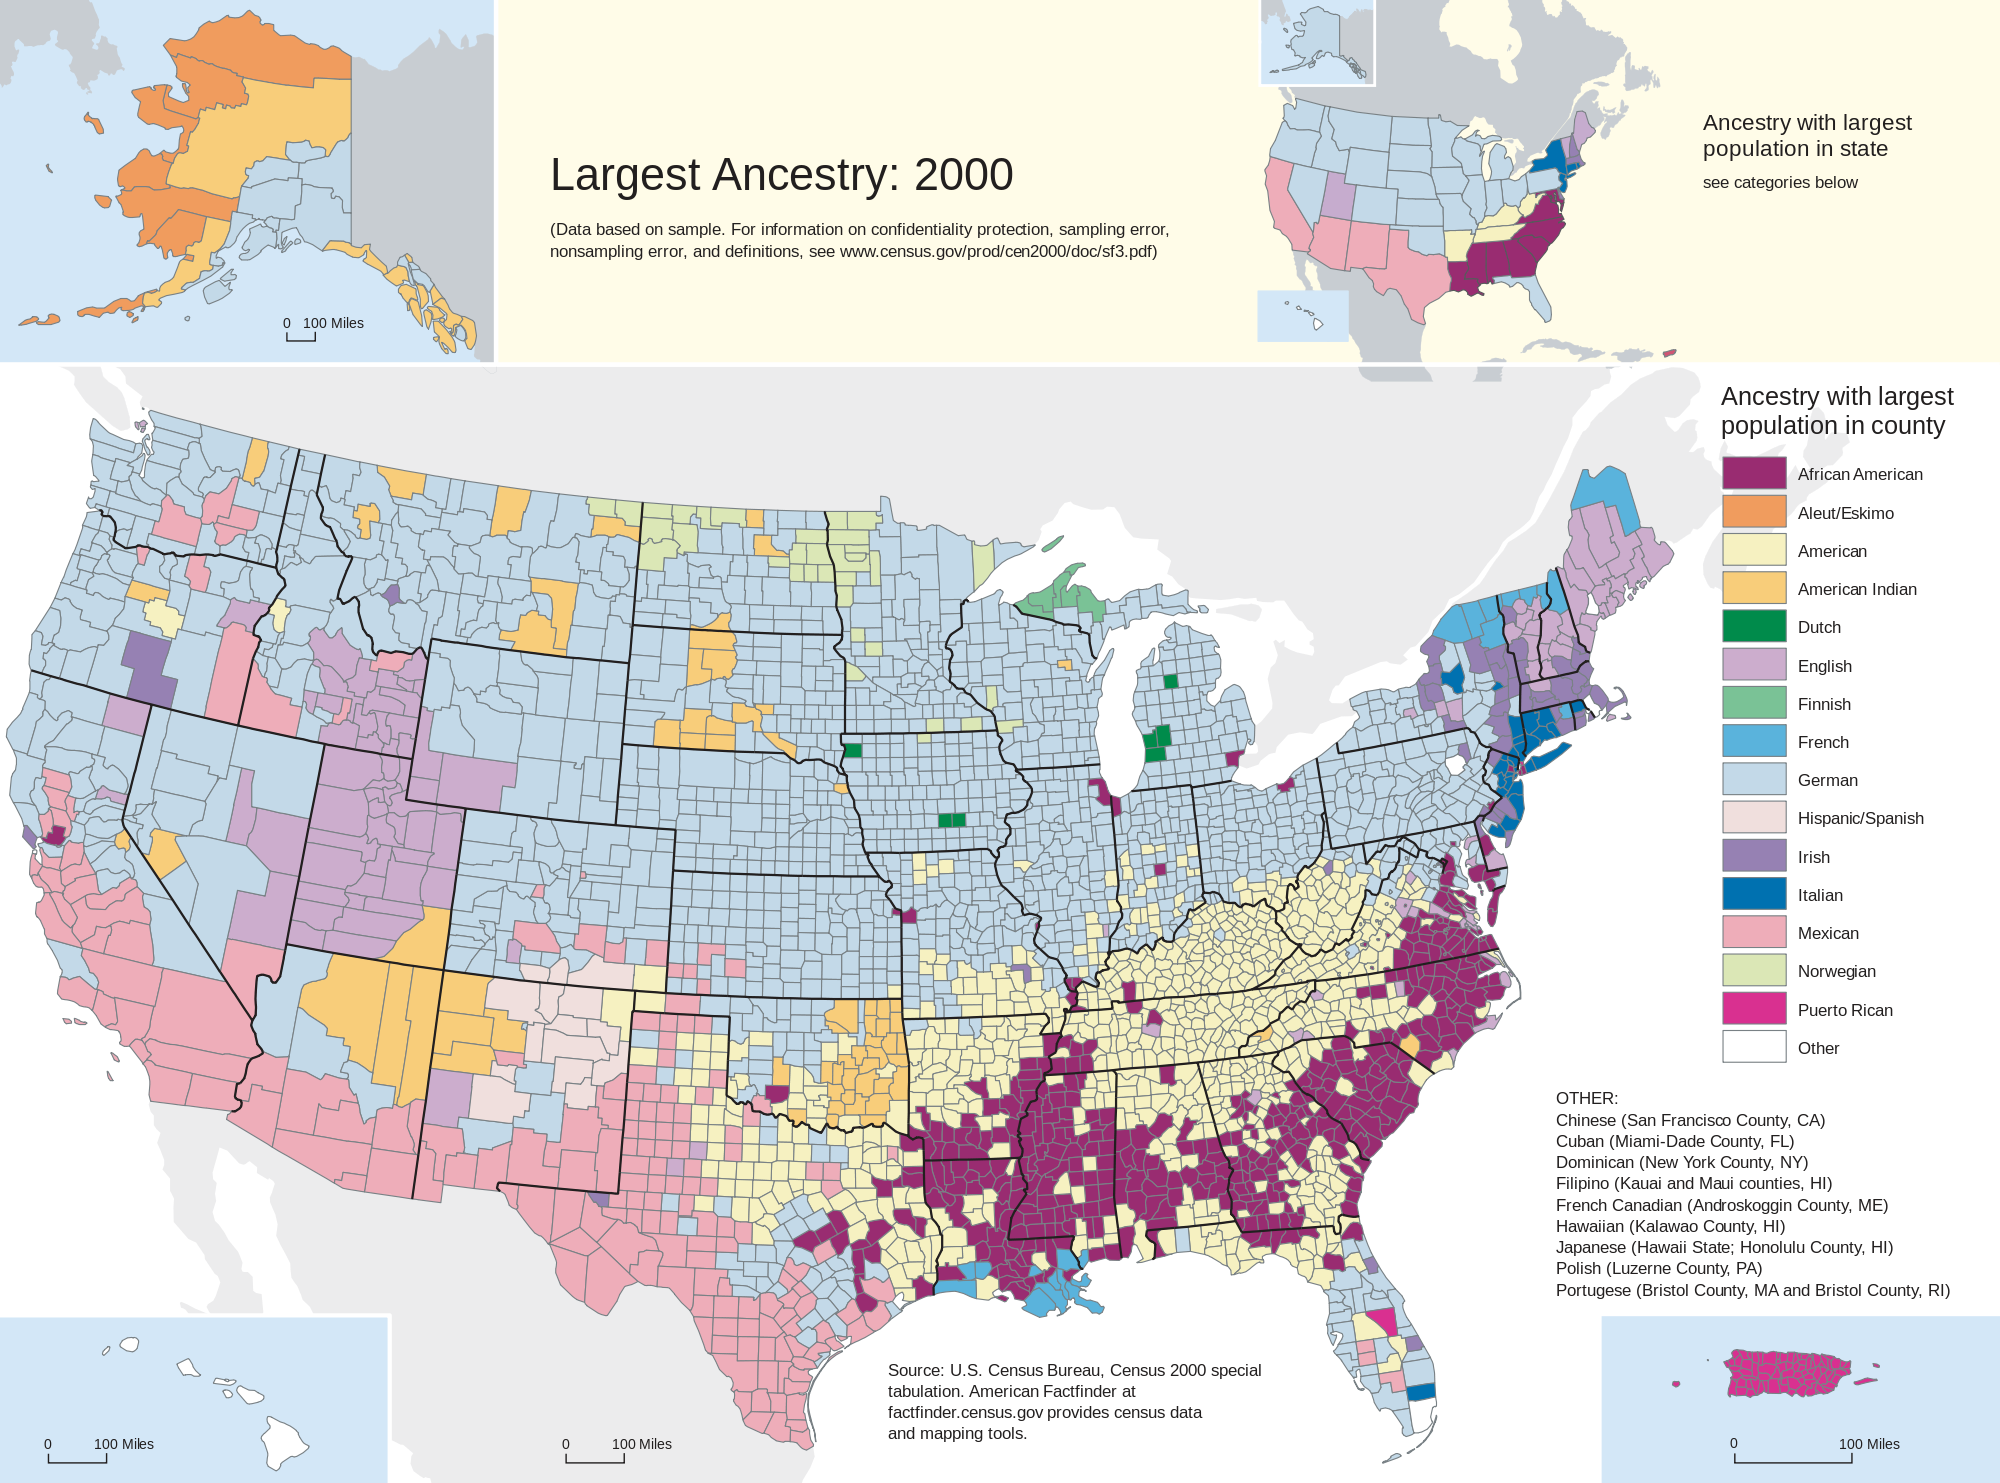
    This map from the 2000 census colors each county according to which country most of its residents cite as their “ancestry.” What might be most surprising about this map is the predominance of light yellow in Appalachia; in those counties, more people say their ancestry is simply “American” than anything else. But this is a strikingly recent phenomenon: the number of people saying their ancestry was “American” nearly doubled from 1990 to 2000. It’s amazing that in a country that’s been around for more than 200 years — with many family lineages having lived in the New World for even longer — most people are still able to identify their ancestry based on the countries in which their families lived before they immigrated to the United States.

  2. The very first American migration

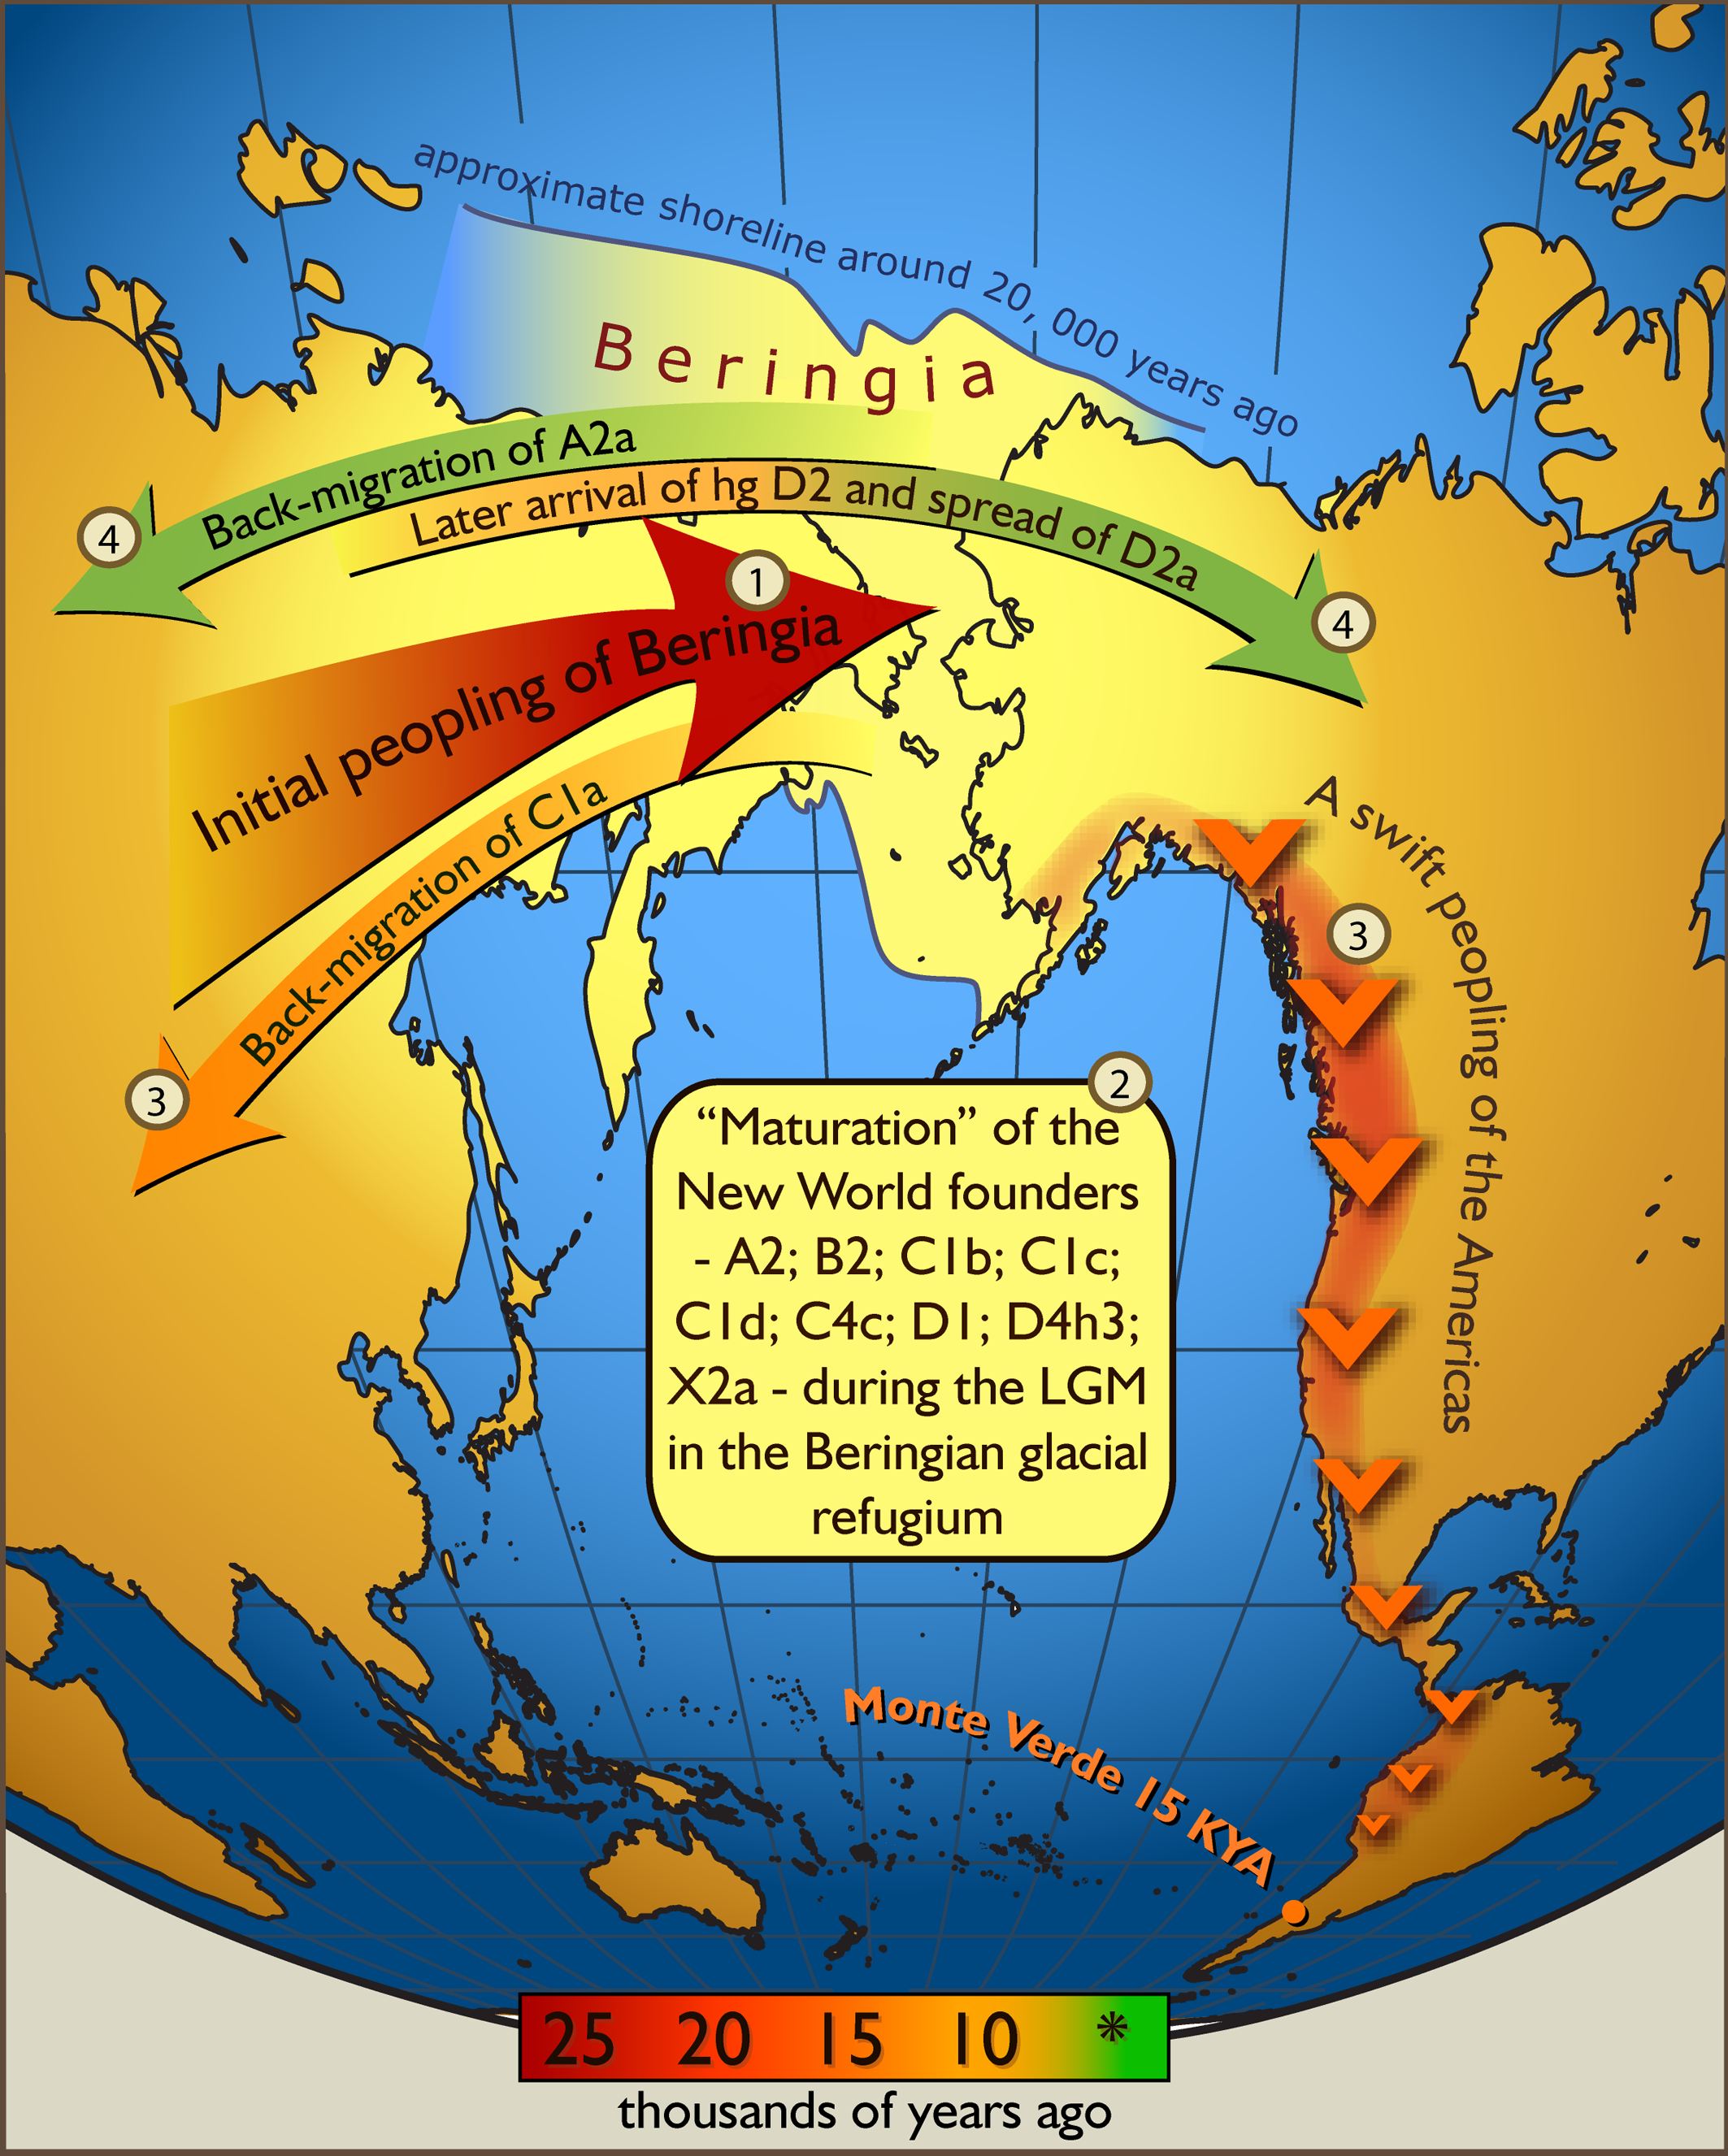
    Even the first Americans were immigrants — it’s generally accepted that they came across “Beringia” (the land that’s now the Bering Strait, the body of water between Russia and Alaska) at least 20,000 years ago (and possibly as long as 30,000 years ago). But scientists are still trying to piece together when the first Americans came through Beringia; how many of them there were; and whether they came all at once, or in multiple waves.

    This map, from a 2007 paper, is based on an analysis of mitochondrial DNA — which children inherit only from their mother, making it easier to trace one line back for many generations. The researchers hypothesize that the group that came to Beringia from Asia, approximately 25,000 years ago, actually stayed in Beringia for some time before some of them came through to the Americas. Then, however — according to this analysis — they populated the Americas fairly quickly, spreading as far south as Chile by 15,000 years ago. The analysis also suggests that some early Americans migrated back to Asia from Beringia, while other, newer waves of immigrants crossed to America.

  3. America has more immigrants than anybody

    Later waves of European immigration killed off most of the first Americans (largely through European diseases, which traveled through the Americas much more quickly than European humans did). That set the stage for European Americans to rebrand the United States, in particular (where indigenous populations were almost completely “replaced”), as a “nation of immigrants.” Even today, America is still home to more total immigrants than any other country in the world. In this map, each country’s size is distorted to reflect the size of its immigrant population. It’s based on 2005 data, but a 2013 UN report shows that 19.8 percent of the world’s international migrants live in the United States.

  4. …but as a share of the population, the US doesn’t crack the top 10

    As much as American politicians pat themselves on the back for representing “the most welcoming country in the world,” there are smaller countries that have been more open to immigrants in recent decades. So on this chart from the Organisation for Economic Co-operation and Development (OECD), which measures the percentage of each country’s population that was made up of immigrants in 2000 (the orange dot) and 2010 (the blue bar), America doesn’t even hit the top 10. Some of the countries that outrank the United States are tiny — it’s much easier for 40 percent of Luxembourg’s population to be immigrants, since the country has only 540,000 people, than it would be for the United States — but medium-size countries like Canada, Australia, and Spain also outrank the United States.

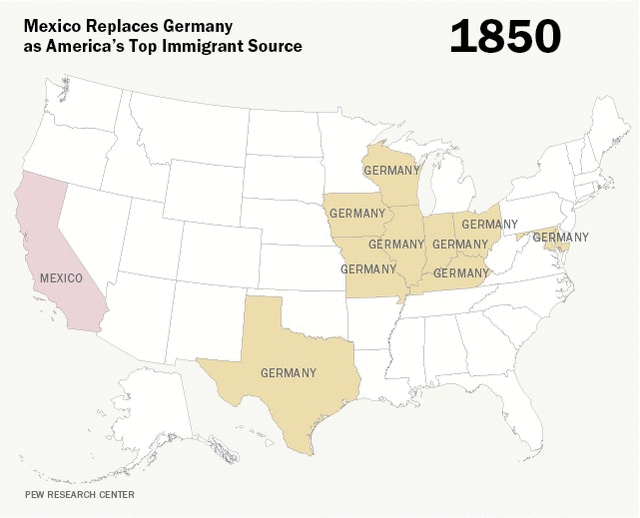
  5. The simplest explanation of how immigration to America has changed

    If this feature were called “A nation of immigrants in one map,” this is the one we’d show you. The bottom line: before 1965, Germany sent more immigrants to America than anyone else; after 1965, Mexico did.

    Here’s why: from World War I to 1965, the immigration system was designed, essentially, to keep the United States white. Rice University sociologist Stephen Klineberg has called it “unbelievable in its clarity of racism.” Each country was given a certain quota of immigrants who were allowed to come to the United States each year, based on who’d been in the country in 1890.

    Combined with existing laws that prevented any Asian Americans from coming into the country, the laws of the 1920s basically froze the demographics of the immigrant population in place until 1965.

  6. The Danish Utahns, and other immigrant enclaves

    This GIF, compiled by internet hero @MetricMaps, tracks where immigrants from different countries have settled in the United States. The result is an exhaustive portrait of more than two dozen different native countries and regions. Some ancestry groups pop up in interesting places, revealing forgotten pockets of American history — the Danish population in Utah, for example, is the result of an extremely early wave of Danish conversion to the Church of Jesus Christ of Latter-Day Saints (Mormons).


Forced migration, then and now

  1. David Eltis and David Richardson/Atlas of the Transatlantic Slave Trade, reprinted with permission of Yale University Press

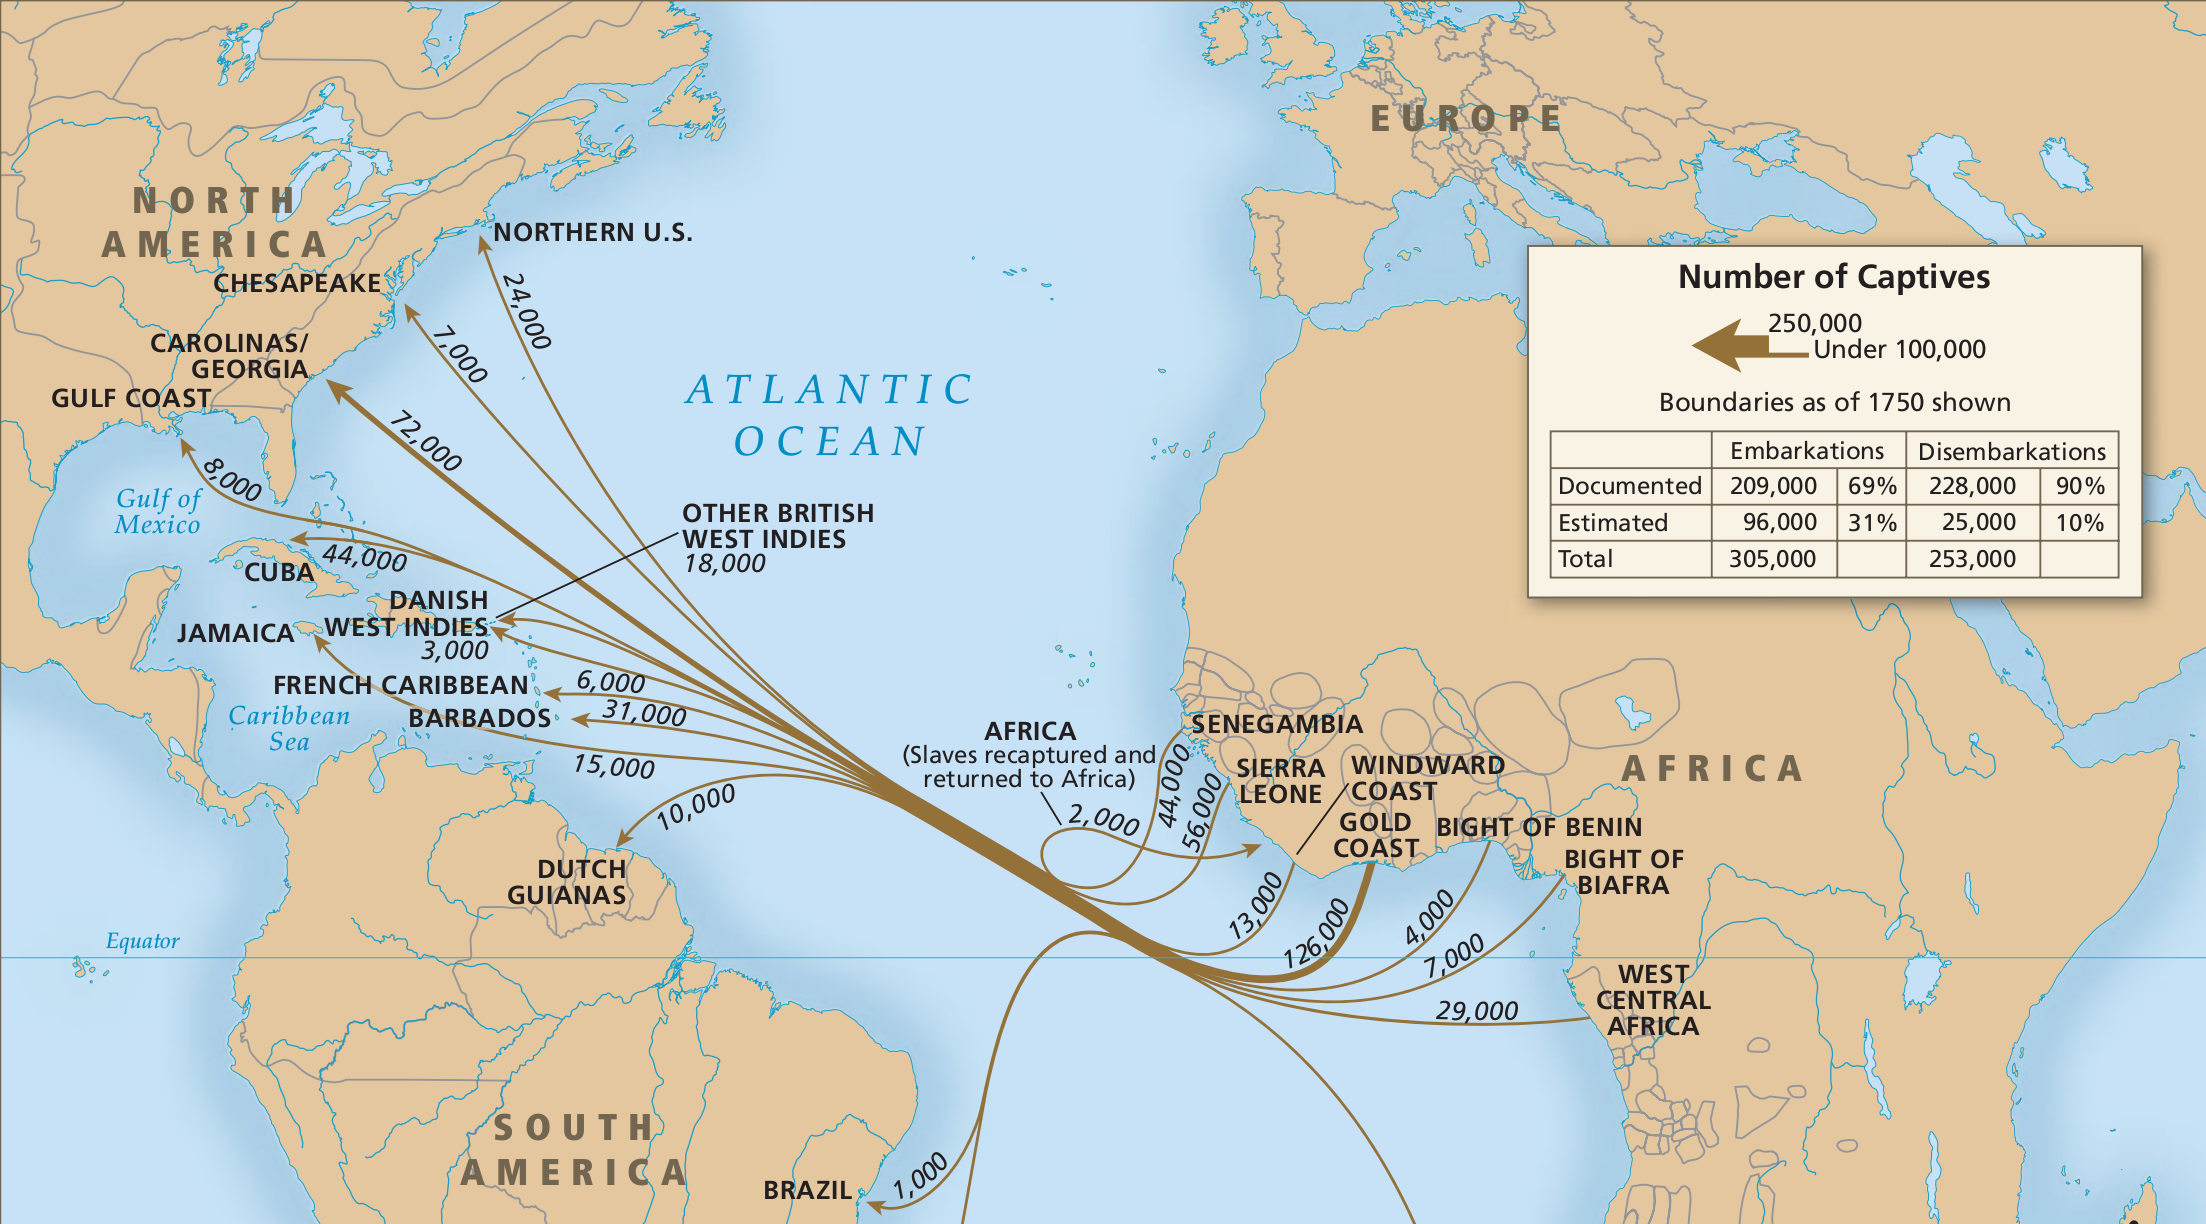
    Forced migration built America

    The American myth about “a nation of immigrants” excludes millions of forced migrants to America from Africa, who were brought to the US over two centuries of the trans-Atlantic slave trade. It’s hard to overstate how much slaves built America: according to historian Steven Deyle, the value of all slaves in 1860 was seven times the value of all currency then in circulation in the United States. Slave labor built the agrarian economy of the South and fed the cotton mills of the industrializing North. But slaves had no way to become citizens, build wealth, or bring their families — they had no opportunity to practice the self-reliance that America often expects of its immigrants.

  2. David Eltis and David Richardson/Atlas of the Transatlantic Slave Trade, reprinted with permission of Yale University Press

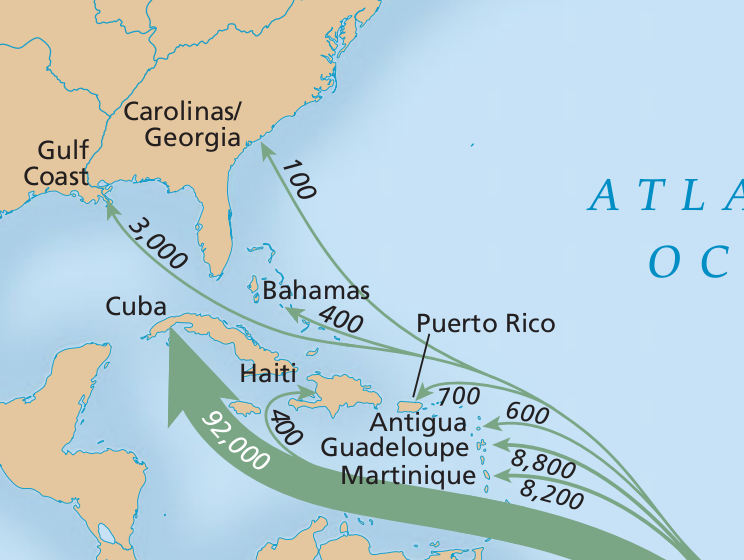
    The first illegal migrations were of trafficked slaves

    The forced migration of Africans to America also represents the first unauthorized migration to the United States. The Constitution banned the “importation” (trafficking) of slaves into the United States after 1809, but black-market slave trading continued until the Civil War. According to historian David Eltis of Emory University, 1.5 million Africans arrived in the Americas after the countries they landed in had theoretically banned the slave trade. Because there were no restrictions on voluntary migration to the United States until the 1880s, these were the first people to come to the country illegally.

    The Atlas of the Transatlantic Slave Trade documents 78,360 slaves landing in mainland North America from 1800 to 1865 — about 20 percent of all arrivals over the 200 years of the slave trade. (Since slave importation wasn’t banned until 1807, many of those arrivals could have been legal.)

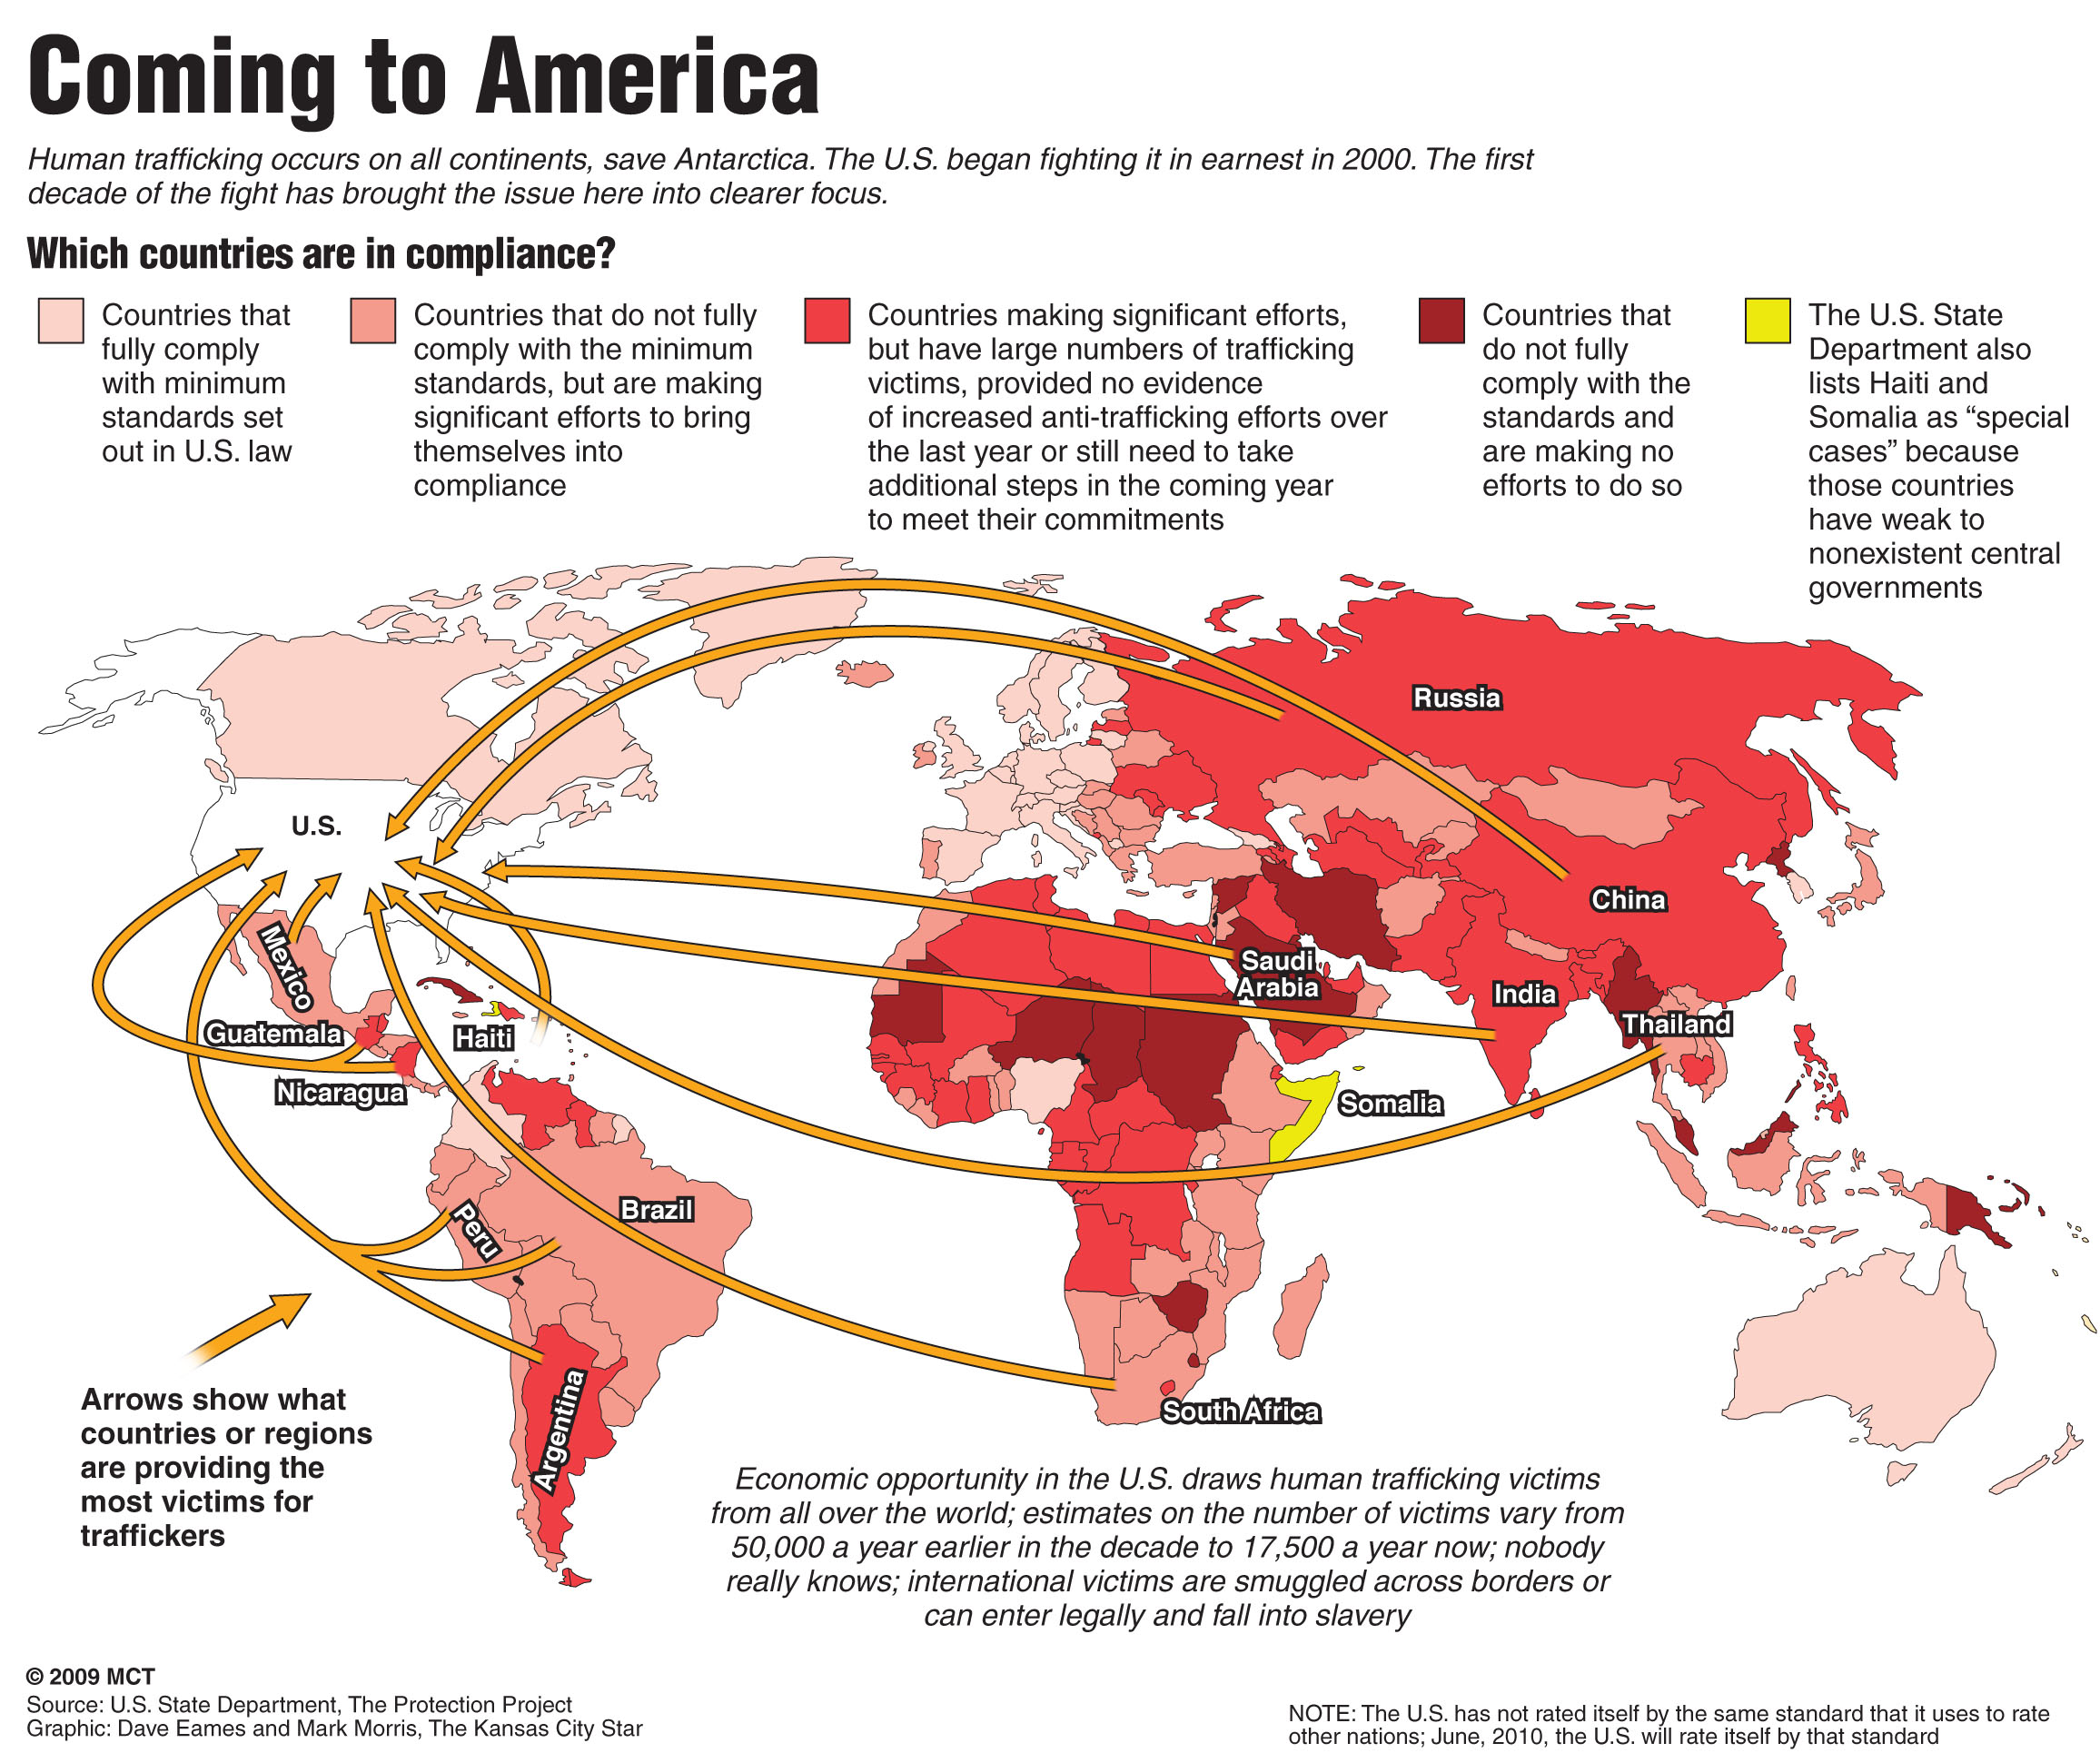
  3. Modern-day forced migration: human trafficking

    Large-scale human trafficking is no longer legal, let alone widely condoned. But it still happens. This graphic is one attempt to map the global reach of the contemporary human-smuggling industry.

    A report by the Urban Institute in 2014 interviewed 122 victims of labor trafficking in the United States, and found that 71 percent of those traffickedactually had legal visas when they arrived in the country. But because immigrant workers’ legal status is tied to their employer, most victims who escaped their traffickers had lost their legal status by the time they were connected to law enforcement. Furthermore, the report found, public officials often encountered labor-trafficking victims and failed to realize what was going on — or, worse, sided with the traffickers and threatened to report the victims to federal immigration agents.


A nation of immigrants

  1. The most famous immigrant in American history

    Give me your tired, your poor;
    Your huddled masses yearning to breathe free;
    The wretched refuse of your teeming shore;
    Send these, the homeless, tempest-toss’d, to me;
    I lift my lamp beside the golden door.

    —Emma Lazarus, 1883

    Of course, the Statue of Liberty was itself an immigrant. It was designed and cast in copper in France over the span of a decade, from 1876 to 1884, as an intended gift from the French government to the United States. But the statue then had to wait in France for several months until the Americans had done enough work on its pedestal. It was then shipped to the United States in 350 separate pieces, housed in 214 crates, to be assembled by American workers once it arrived.

  2. An insanely detailed map of immigrants in America from 1903

    This exhaustive map includes 51 infographics (for each state plus Washington, DC). The right column of the infographic covers how many immigrants settled in the state each year; the left column shows their occupations. The top depicts the ethnic mix, color-coded by race: Teutonic, Keltic, Slavic, Iberic, Mongolic, and “all others.”

    At the time, those racial labels were real — and the source of anxiety. A medical journal article from this era expressed concern about the “preponderance of the Iberic and Slavic races” among recent immigrants, because of “their poorer physical and mental equipment” compared to “Celtic and Teutonic” immigrants.

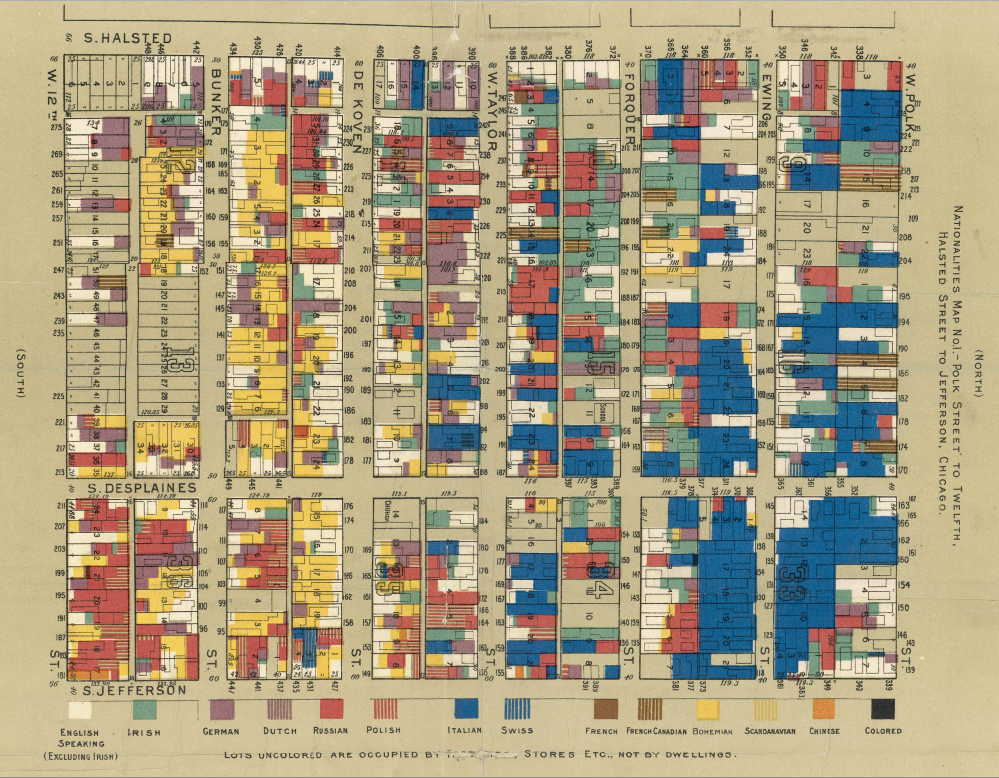
  3. How charities helped immigrants become American

    The organization Hull House (founded by Jane Addams) was devoted to serving Chicago’s urban poor; in the process, it set the template for charity in America. And most of Chicago’s urban poor were immigrants: in 1890, in fact, immigrants made up 77 percent of the city’s population. To better tailor its services to the communities it served (and to assist the federal government in its study of urban “ghettos”), Hull House researchers produced maps like this one, which shows the ethnicity of each immigrant family living in a given tenement block.

    The result was that Hull House increasingly focused on teaching English, civics, and other skills that would help immigrants and first-generation Americans assimilate — what would be called the “Americanization” movement. The existence of organizations like Hull House, which were willing to take the time to help immigrants acclimate to America and learn things (like English) that they needed to succeed, was an important factor in helping the European immigrants of 100 years ago assimilate to the point where they simply counted as “white” Americans.

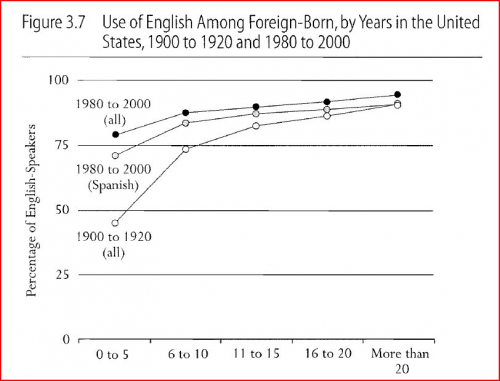
  4. Are today’s immigrants less Americanized?

    The “Americanization” movement of the early 1900s wasn’t just about how to help immigrants. It was also grounded in the belief that immigrants should be welcomed to the United States only if they wanted to, and could, be successfully assimilated into America. That idea survives today, in everything from the metaphor of the country as a “melting pot” to the demand that immigrants “learn English.” But while “learning English” is shorthand for assimilation, and despite fears that this generation of immigrants is less assimilated than their forerunners, immigrants to America in the late 20th century were much more likely to know English when they got here, or to pick it up quickly, than the immigrants who lived at Hull House. Even Latino immigrants, who lag behind other immigrants (who tend to be more educated) in how long it takes them to speak English, perform much better than the European immigrants of the 1880s.

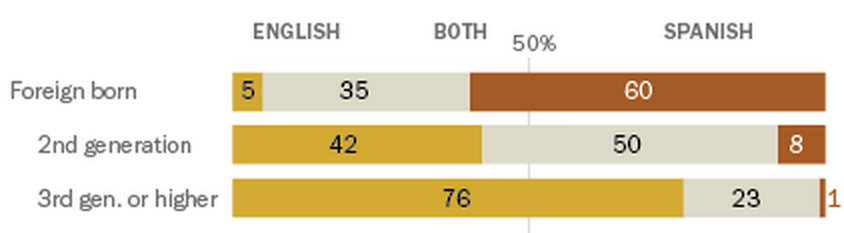
  5. The grandchildren of today’s Latino immigrants barely speak Spanish

    Second-generation Latinos — the children of immigrants — tend to be fully bilingual; this might mean they’re used to speaking with their parents in Spanish but using English outside the home, or just that they’re in situations where they deal with Spanish and English speakers pretty much equally. And with the third generation, who are grandchildren of immigrants, bilingualism fades quickly. In fact, the proportion of immigrants who speak mostly English (35 percent) is bigger than the share of Latinos who are thoroughly bilingual in the third generation.

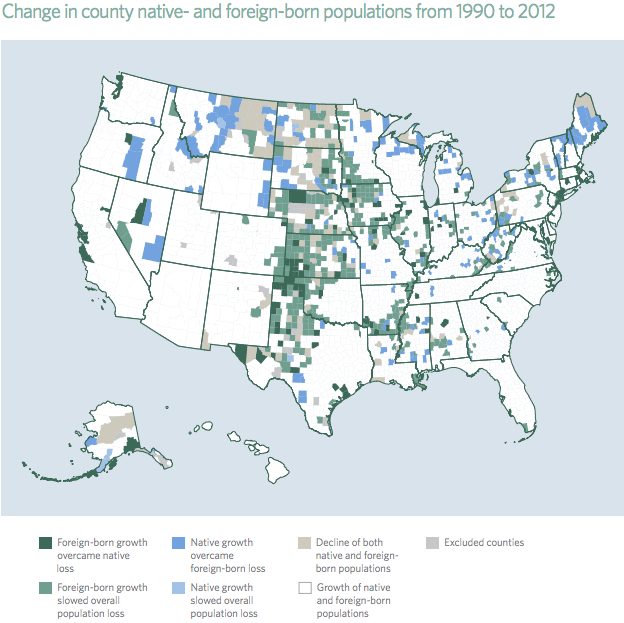
  6. Immigrants are saving the Midwest

    More Americans are leaving Middle America than moving there (with the exception of North Dakota). But immigrants are forestalling Middle America’s demographic decline. A Chicago Council study in 2014 found four metro areas (including Davenport, Iowa, on the Illinois border, and Duluth in eastern Minnesota) that grew between 2000 and 2010 solely because of the immigrant population, and another five where immigrants made up more than 50 percent of the metro area’s total growth over that time. But immigrants might be having an even bigger impact in rural areas in Middle America, where the demographic crunch is most acute. In Kansas, immigrants make up 5.3 percent of the rural population; in Nebraska it’s 4.8 percent. Just as importantly, immigrants are making these areas demographically younger. The Chicago Council report found that Wichita, Kansas, for example, lost 24 percent of its 35- to 44-year-old, native-born population from 2000 to 2010 — but its immigrant population in that age range grew by 87 percent.


A nation of (immigration) laws

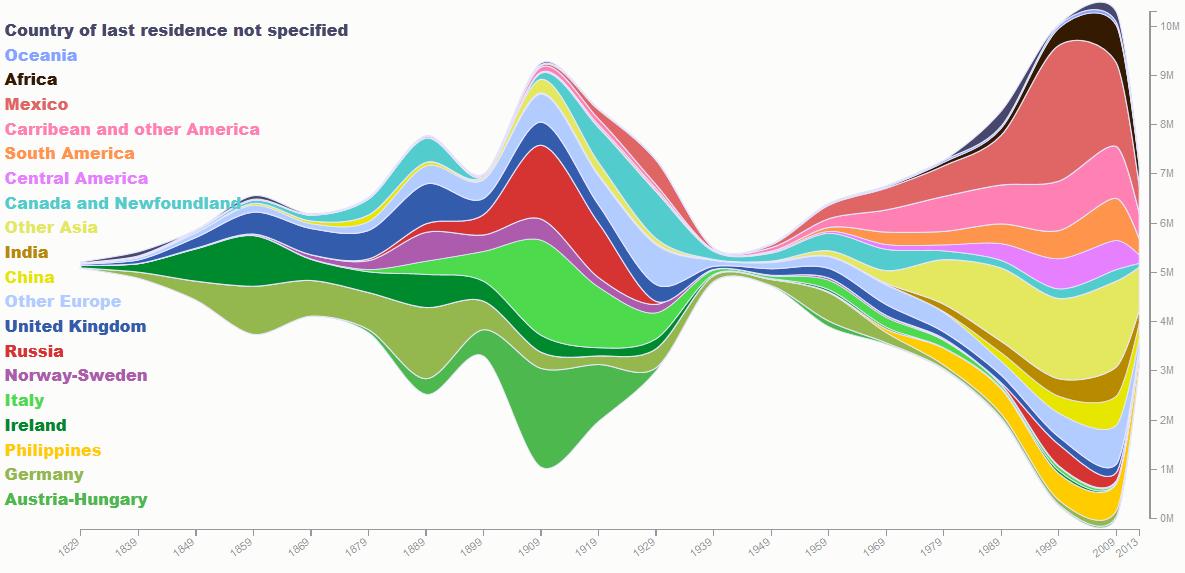
  1. 200 years of immigration in one gorgeous visual

    It’s easy now to assume that Mexico has always been among the main sources of immigration to America. But as this wonderful chart by Natalia Bronshtein (using 200 years of government data) shows, that’s not even close to true. There’s an interactive version on Bronshtein’s website: you can hover over any color, at any point, and see the exact number of immigrants who became residents from that country in that decade. But taken as a whole, the chart tells a very clear story: there are two laws that totally transformed immigration to the United States.

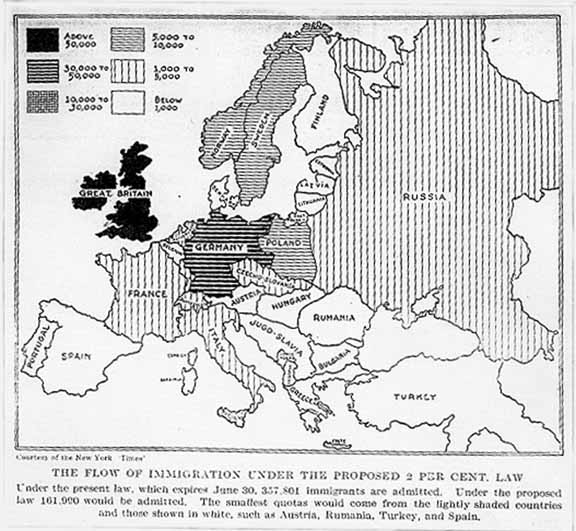
  2. The 1920s law that made immigration much less diverse — and created illegal immigration as we know it

    Because the quota laws were passed in the early 1920s, but were based on immigration flows from 1890, they actually rolled back immigration from certain countries. Politicians were worried that new immigrants from Southern and Eastern Europe (largely Italians and Jews) were genetically “inferior” immigrant stock was threatening Americans’ quality of life. This pair of maps, from the New York Times, shows the effects of the primary quota law: the National Origins Act of 1924. The map to the left of the slider shows annual immigration to America from various European countries before the law was passed; the map to the right of the slider shows the quotas imposed for each country under the law. The National Origins Act forced the legal immigrant population to plummet — and made “illegal immigration” a widespread phenomenon for the first time in American history. It hasn’t stopped since.

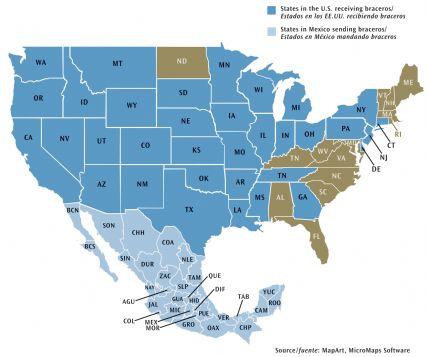
  3. How America began to rely on Mexican labor

    With World War II causing labor shortages, the United States started to encourage seasonal labor from Mexico. As the map shows, the 2 million braceros who came under the program (from 1942 to 1964) migrated from all over Mexico to most of the United States. Most worked in agriculture, under punishing conditions: according to some reports, braceros were sprayed directly with DDT (an insecticide now known to be carcinogenic and toxic to humans). The bracero program was supposed to prevent migrants from settling in the United States by sending 10 percent of their paychecks back to Mexico. But many braceros returned to Mexico only to discover their money had not. Many Mexican Americans are descended from braceros, and the memory of their mistreatment colors their opinions of guest-worker proposals today.

  4. America’s only been a global destination for the past 50 years

    The modern era of immigration to America began in 1965, when the restrictionist quotas of the National Origins Act were replaced by the Immigration and Nationality Act. It’s only in this era that immigration to the United States has really become a global phenomenon — with European and Mexican immigrants joined by Asian, Central and South American, and African immigrants. There are still more immigrants from some countries than from others — in 2013, there were twice as many naturalized US citizens from Mexico as from any other country — but as this chart shows, immigration to the United States has never been more globally balanced.

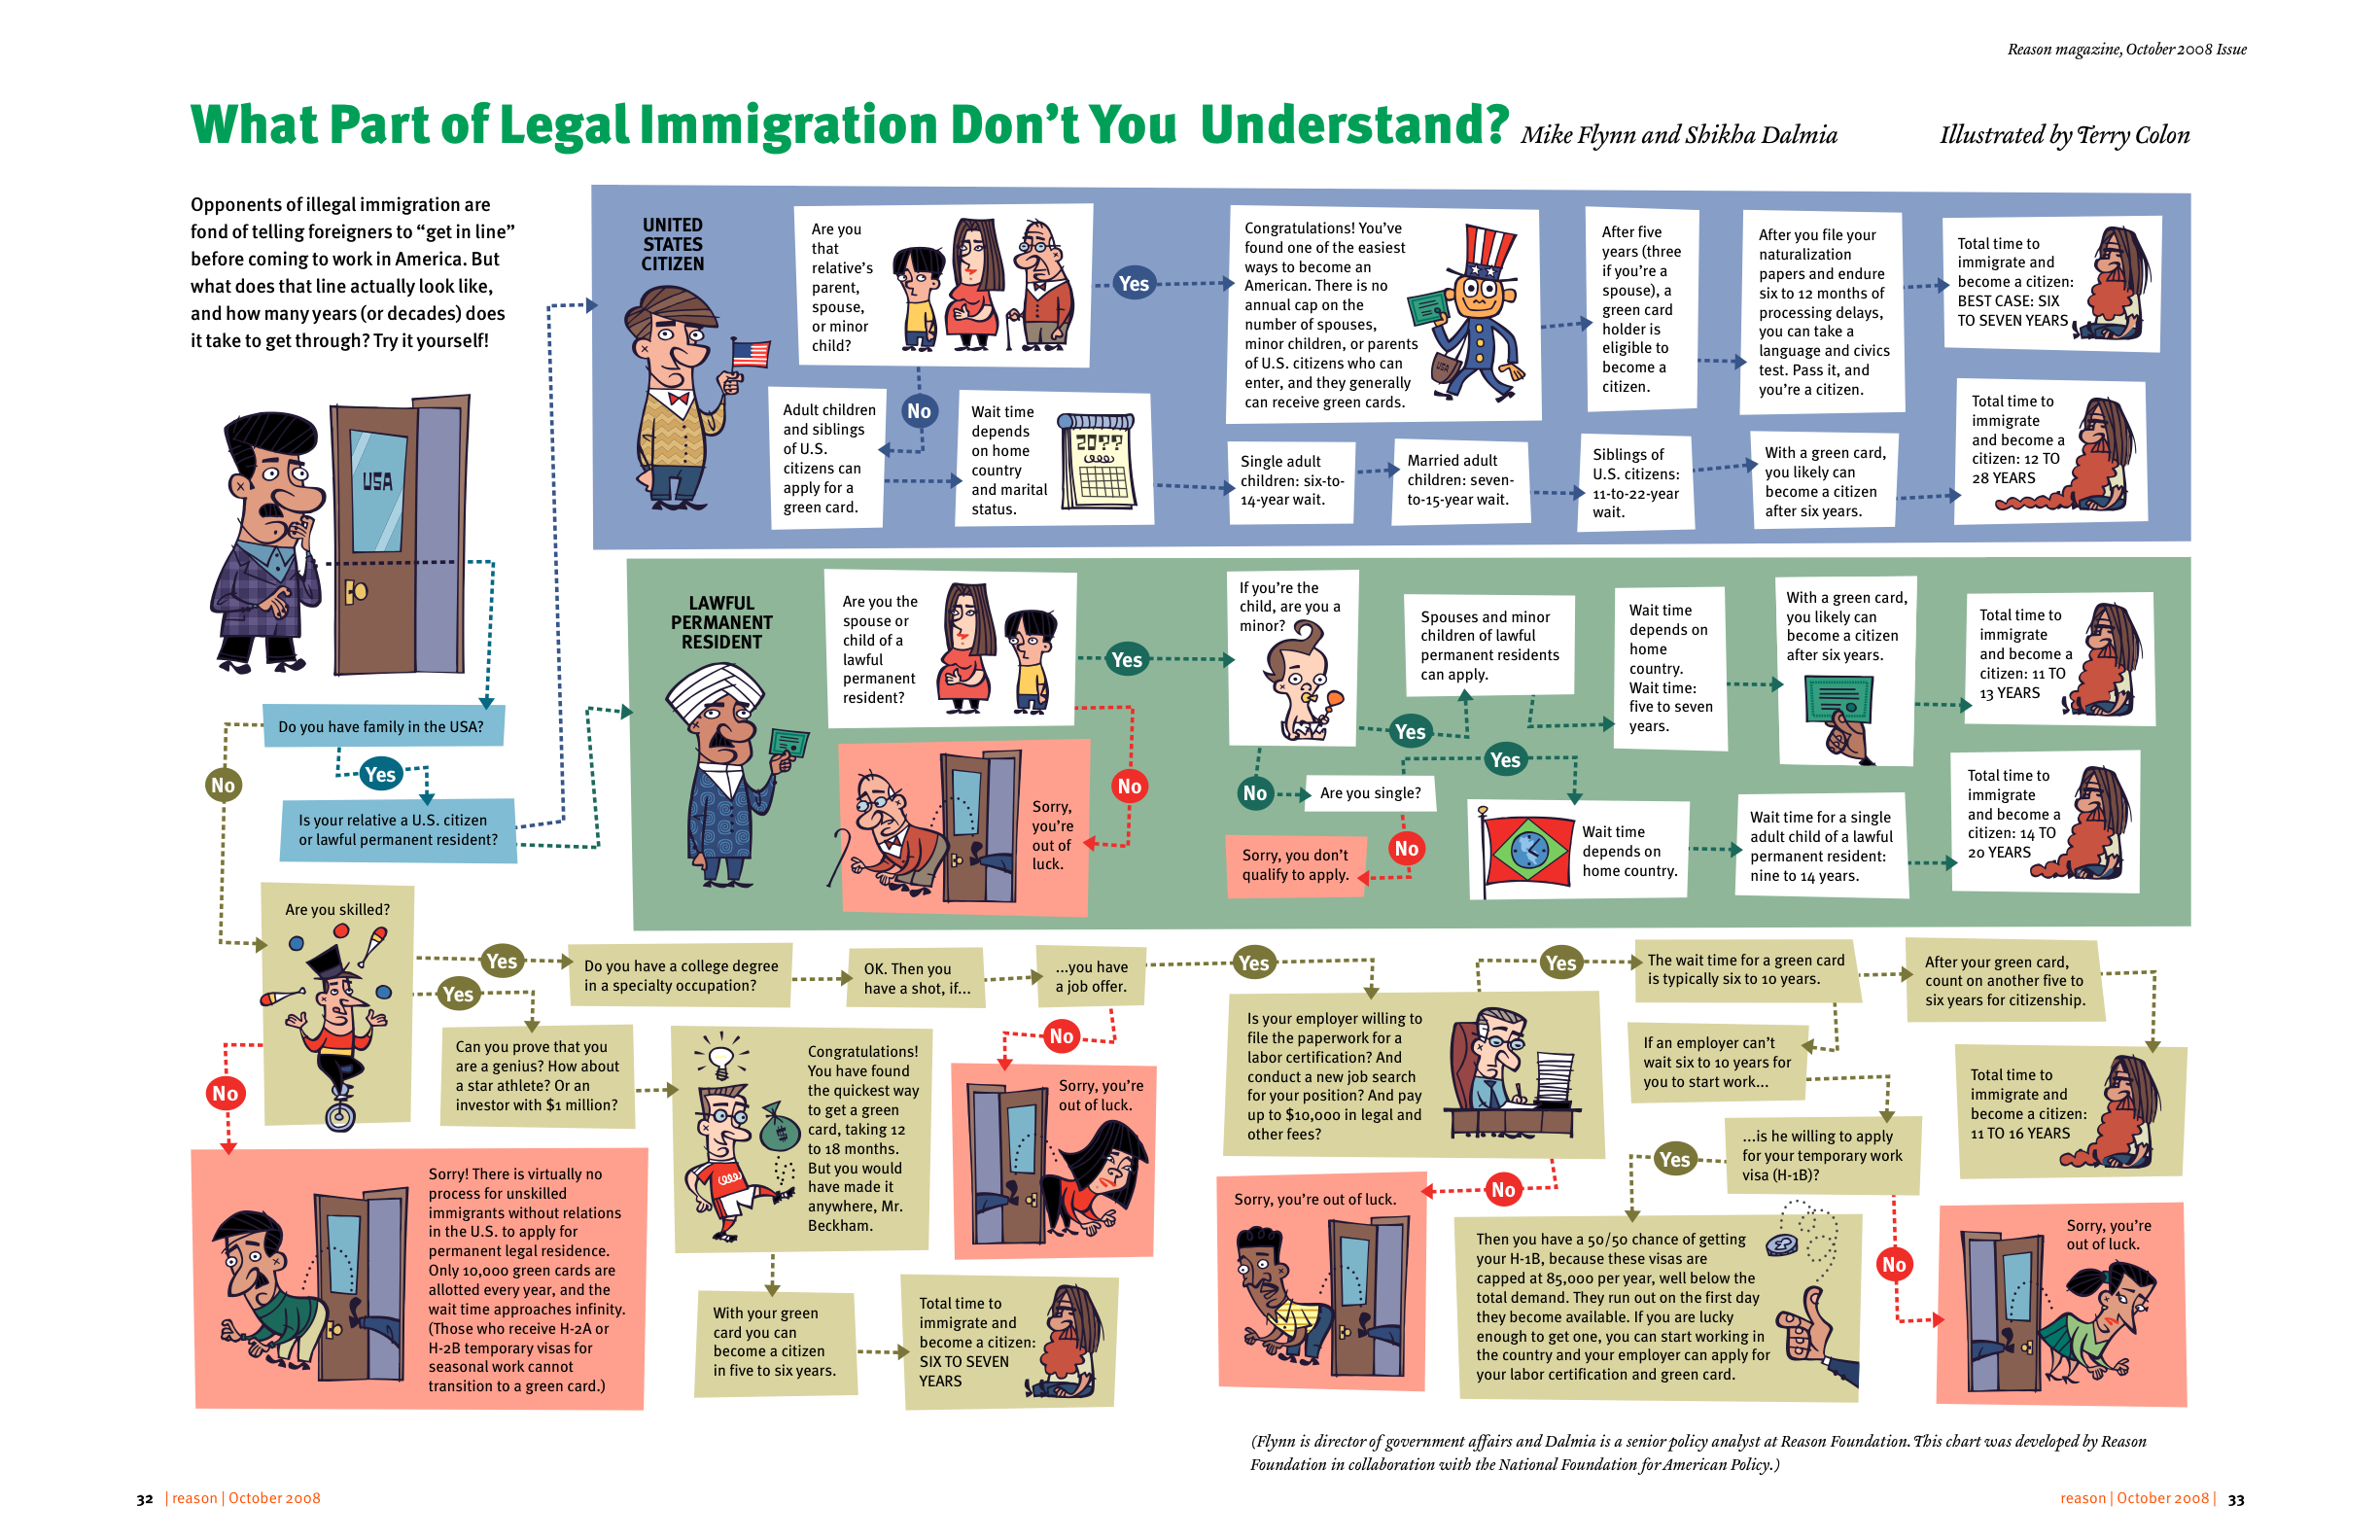
  5. How to come here the right way

    From one perspective, there are plenty of ways to come to the United States legally — there’s an alphabet soup of visas, not to mention immigrant Americans’ ability to sponsor family members for green cards. But the overwhelming majority of the world’s non-American population isn’t eligible for any of these paths. In other words, there’s no legal immigration “line” for them to get into. Furthermore, there are far too many qualified applicants for most available visas — causing years-long (or even decades-long) backlogs for Mexican, Chinese, Indian and Filipino immigrants hoping to bring their parents, adult children, or siblings to the United States. This flowchart, from Reason Magazine, shows who’s able to come “the right way” and who isn’t. Spoiler alert: most aren’t, and most of those who are will have to wait a long time.

  1. Joe Posner/Vox

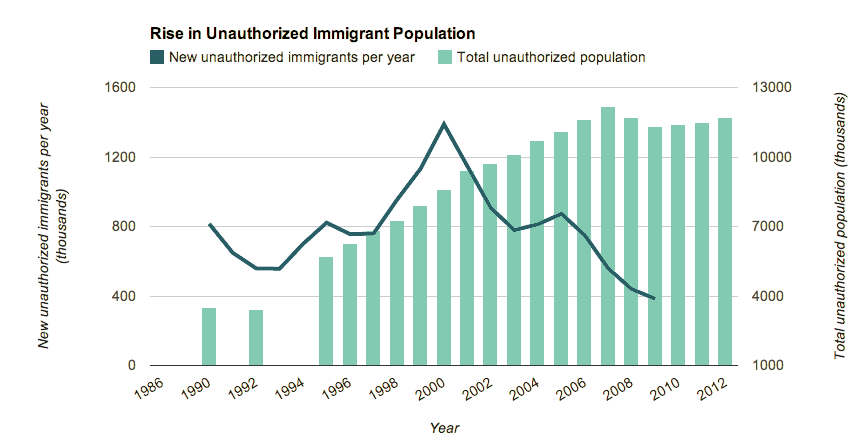
    The era of unauthorized immigration: 1996–2006

    This chart documents the biggest wave of unauthorized migration in US history: from 1996, when the economy was booming and a law made it harder for unauthorized immigrants to “get legal,” to the US recession of the late 2000s. The line graph (and the left y-axis) shows how many immigrants entered the country illegally each year; the bar chart (and the right y-axis) shows the estimated number of unauthorized immigrants living in the United States at that time.


Nativism, then and now

  1. One reason some Americans fear immigrants? They overestimate how many there are

    Americans have an unfortunate tendency to overestimate how many people in the United States are immigrants — possibly because many white Americans assume that most Latinos in the United States are immigrants (and some assume most Latinos in the United States are unauthorized immigrants). Fears of America being overrun by immigrants make a little more sense if you think that a third of people living in the United States are immigrants already.

  2. America’s first single-issue party was anti-immigrant

    The American Party of the 1840s and 1850s was often called, and is remembered today as, the “Know-Nothing Party.” In the 1856 presidential election, as shown here, Maryland sent its electoral votes to the party (which had nominated former President Millard Fillmore). The leading Know-Nothing in Congress, Lewis Charles Levin of Pennsylvania, was also the first Jewish member of the US Congress. American nativists have usually been more afraid of some kinds of immigrants than others — and one way for an immigrant to assimilate into American life is to play the “good immigrant,” attacking the bad ones.

  3. When Louisville rioted against Catholic immigrants

    In 1855, the Know-Nothing Party was beginning to take over politics in Louisville, Kentucky. The night before a local election in August, Know-Nothings armed with torches paraded through the city’s Catholic areas, telling voters to “keep their elbows in.” That day — fueled by rumors that hundreds of armed Germans were taking over polling places, and that an Irishman had killed a Know-Nothing — the Know-Nothings exploded into wholesale rioting in the Irish and German sections of town. At least 22 people were killed — and probably many more. From the blog the Public I: “The death toll would have been higher but in the German district one of the first buildings looted was Armbruster’s brewery. The rioters got so drunk they could only satisfy themselves with torching the building before passing out.”

  4. An 1885 “vice map” of San Francisco’s Chinatown

    The first immigration restrictions in US history were passed in 1882, when the Chinese Exclusion Act more or less eliminated legal immigration from China. This created a market in human smuggling and trafficking — especially of young Chinese women. The US Customs and Border Protection website is still proud of the agency’s work in “kidnapping” Chinese women “in order to save them” from brothel owners and human traffickers. But as this “vice map of Chinatown,” created by the City of San Francisco, shows, attempts to “save” immigrant victims from their traffickers often bled into prejudice against the immorality of the immigrant community itself.

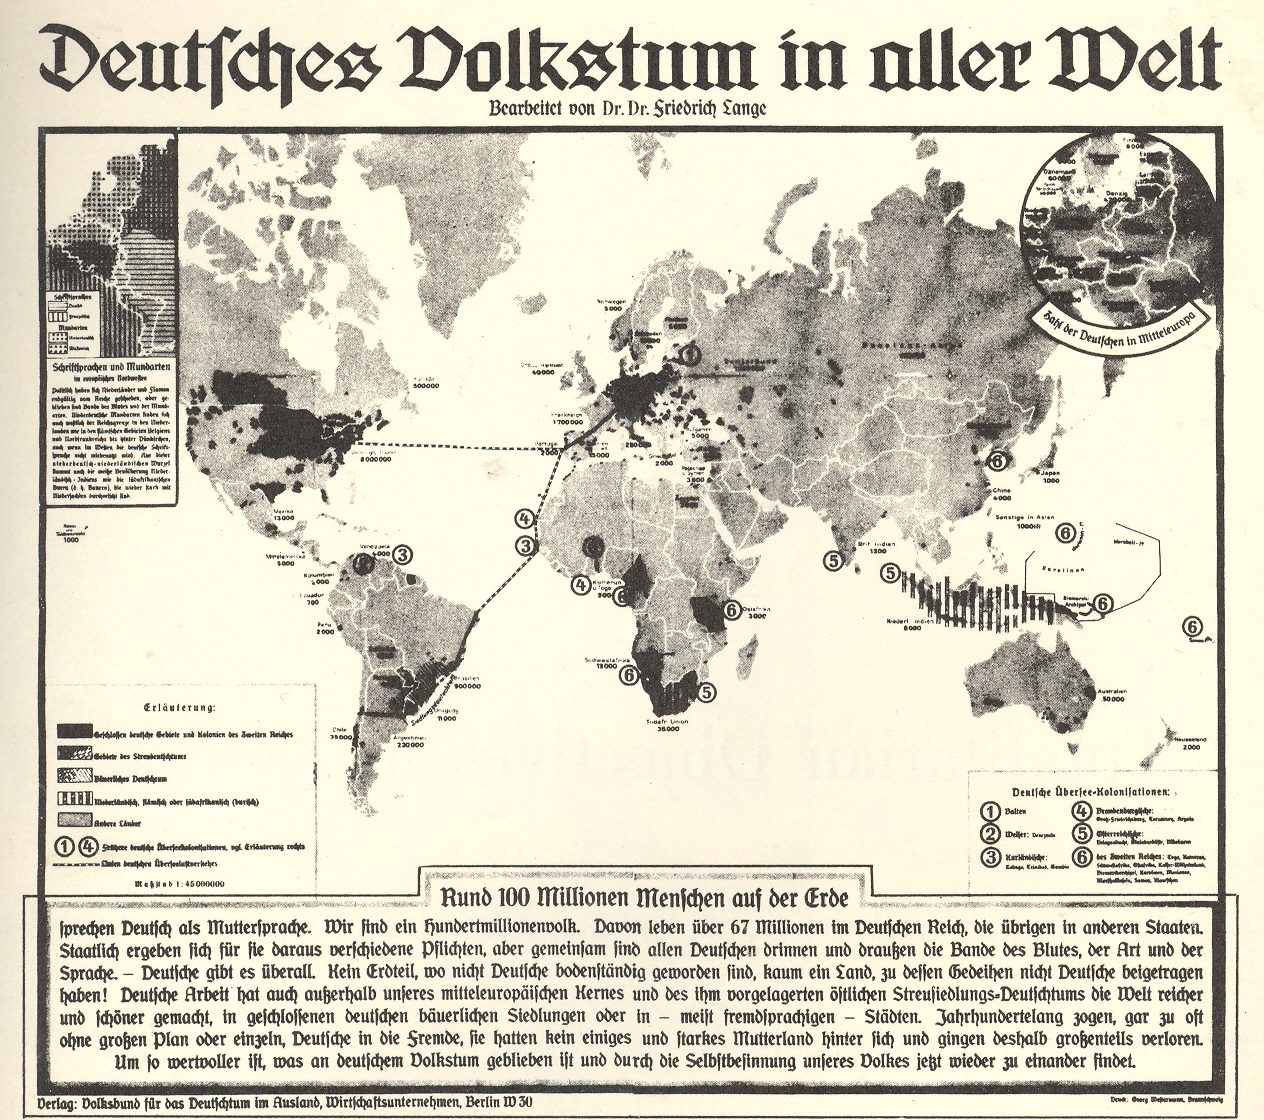
  5. Fears of an immigrant “fifth column” bought into Nazi propaganda

    One of the recurring themes in American nativism is the fear that immigrants will be more loyal to their native countries than to their adopted ones — including in times of war. This map, from a book of Nazi propaganda, tried to exploit those fears. It sent the message that every one of the 20 million German Americans in the United States could be counted on to stand with their homeland rather than with the country that their families had lived in for (in some cases) generations. But the fear was groundless. The United States never had a substantial Nazi-sympathizer movement — and the closest thing to it were the “isolationists,” who were interested in staying out of World War II not because they were loyal to Germany, but because they didn’t feel any connection to Europe.

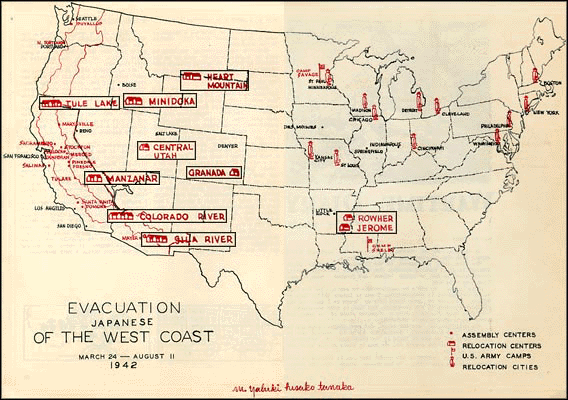
  6. Japanese internment camps

    During World War II, fears of an immigrant fifth column led President Franklin D. Roosevelt to order 120,000 Japanese Americans into internment camps in the western United States. The majority of internees were American citizens, and many were born in the United States. Internment ended in 1944, before Japan surrendered to the United States. But many internees had lost their homes and belongings. Several thousand German Americans and Italian Americans, among others, were also put into camps during World War II. But the scope of the Japanese internment is striking — especially because no Japanese American was ever found guilty of espionage.

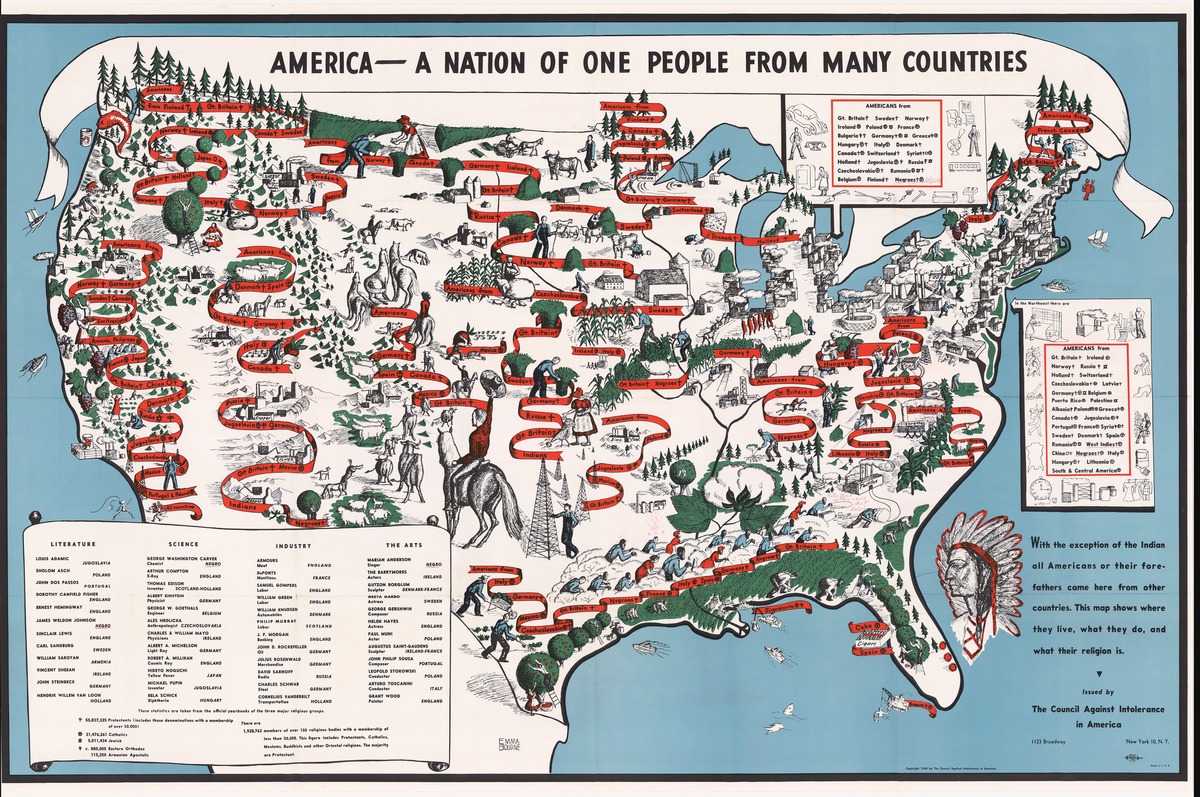
  7. Langston Hughes’s doodles turn a pro-immigrant map into an anti-Jim Crow one

    While other Americans worried that immigrants were a threat to a country at war, the Council Against Intolerance made this illustrated map to argue the opposite: that prejudice itself would weaken the United States against its enemies. It’s a relatively early example of an idea that’s become popular in recent decades: that diversity itself is what makes America strong, and that difference is something to be celebrated rather than eliminated. This particular copy of the council’s map was owned by Langston Hughes, who penciled in a couple of illustrations of his own — including a burning Ku Klux Klan cross near Louisiana — making the point that the people most interested in preserving differences between groups tend to be the ones least interested in tolerance.


A bordered country

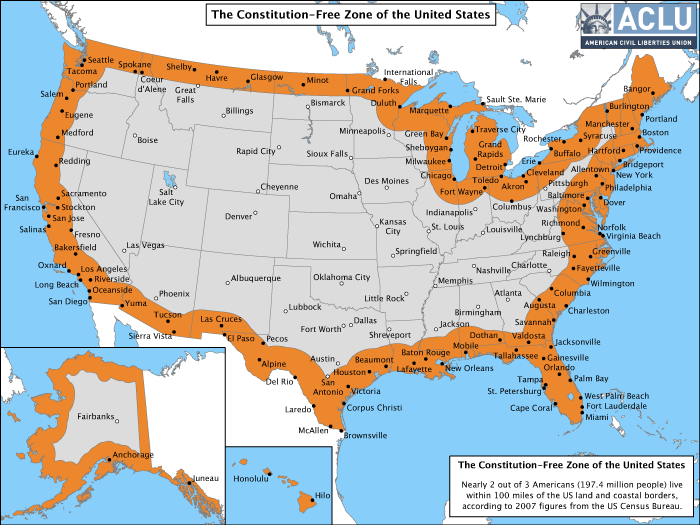
  1. This is what the border actually is

    Popularly, “the border” is a line between United States and Mexico. But officially, it’s a 100-mile area that stretches all the way around the United States — covering as much as two-thirds of the nation’s population. The legal definition of the border matters because the government has long said it can do things “at the border” to track down unauthorized migration and smuggling that it can’t do other places, from setting up “checkpoints” within the United States to check drivers’ citizenship to straight-up racial profiling. As recently as 2011, Border Patrol officers were boarding buses in upstate New York to ask passengers for IDs, and responding to police calls in Forks, Washington. New guidance from the federal government, which came out in December 2014, has opened the door to narrowing the definition of the “border” — but it’s not clear whether it will.

  2. Joss Fong/Vox

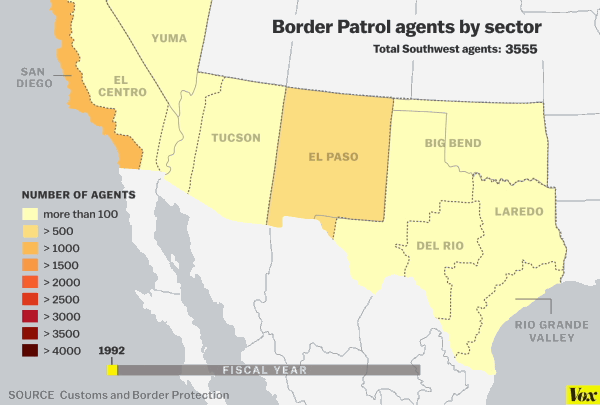
    The militarization of the US/Mexico border

    Increasing border security is a very recent phenomenon: the number of Border Patrol agents on the United States/Mexico border has more than quadrupled from 1995 to 2014. The militarization of the border hasn’t been evenly spaced: it’s concentrated on the areas that people are most likely to cross. The buildup was supposed to stop unauthorized entrances, but it also made it harder for unauthorized immigrants to leave the United States if they ever wanted to return. Immigrants who were used to splitting time between their jobs in the United States and their families at home moved their families to the United States instead — and the unauthorized population grew, and settled.

  3. A volunteer effort to identify immigrants who died crossing the border

    The more agents there are on the high-traffic sectors of the border, the more immigrants try to brave the stretches too dangerous for Border Patrol. That’s made the border more lethal: immigrants often die of thirst or heat exposure when crossing the desert. Some citizen groups attempt to provide water stations to keep migrants safe, though they’ve had to face court cases arguing that they’re trying to encourage people to come to the United States illegally. Officials in Pima County, Arizona, working with a human rights group, use GIS mapping to track deaths of migrants along the border. They’ve recorded 2,187 deaths in Arizona alone from 2001 to 2014.
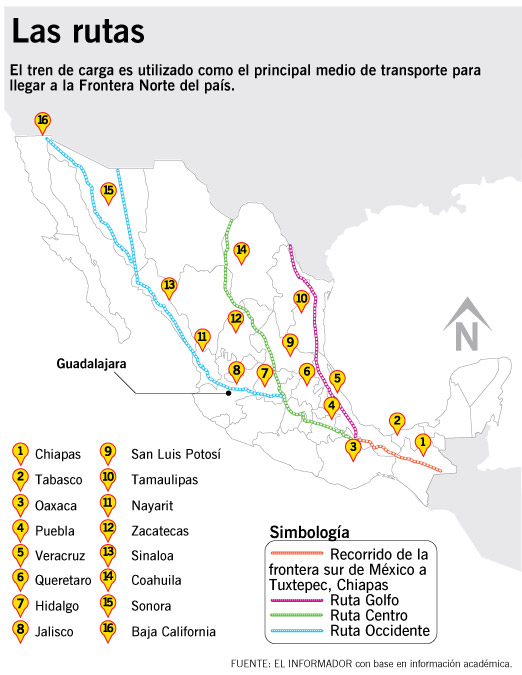
  4. La Bestia

    Mexican freight trains carry cargo-like cars and plastics northward to the United States. They also, for years, have carried Mexican and Central Americans hoping to cross. Hopping “La Bestia” (the popular term for immigrants stowing onto Mexican freight trains) has become a symbol of unauthorized migration to the United States — not just in politics, but in American popular culture. It’s also an illustration of just how far “border security” can stretch outside of the United States’ own territory. In 2014, the Mexican government agreed to force the major freight lines to travel more quickly — a plan that will take a few years — in the hopes that it will be harder for would-be migrants to catch rides. But just as border militarization in the United States simply made the journey more dangerous for desperate migrants, the question will be whether a faster Bestia will deter migrants or punish them.

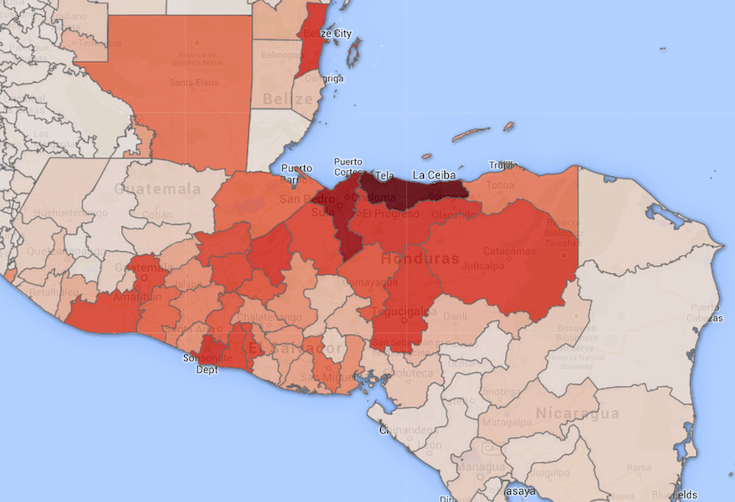
  5. The maps you need to understand the 2014 “border crisis”

    Scholars of immigration agree that people make the decision to migrate based on two types of reasons: “push factors” that lead them to leave their country of origin, and “pull factors” that lead them to come to one new country in particular. When tens of thousands of Central American families and unaccompanied children presented themselves to border agents in Texas in the spring and summer of 2014, many Americans and politicians blamed “pull factors” like President Obama’s Deferred Action for Childhood Arrivals program. But a map created by the Department of Homeland Security, depicting where unaccompanied child migrants were coming from, told a different story: migrants were leaving some of the most dangerous communities in the most dangerous countries in the world.


A borderless world

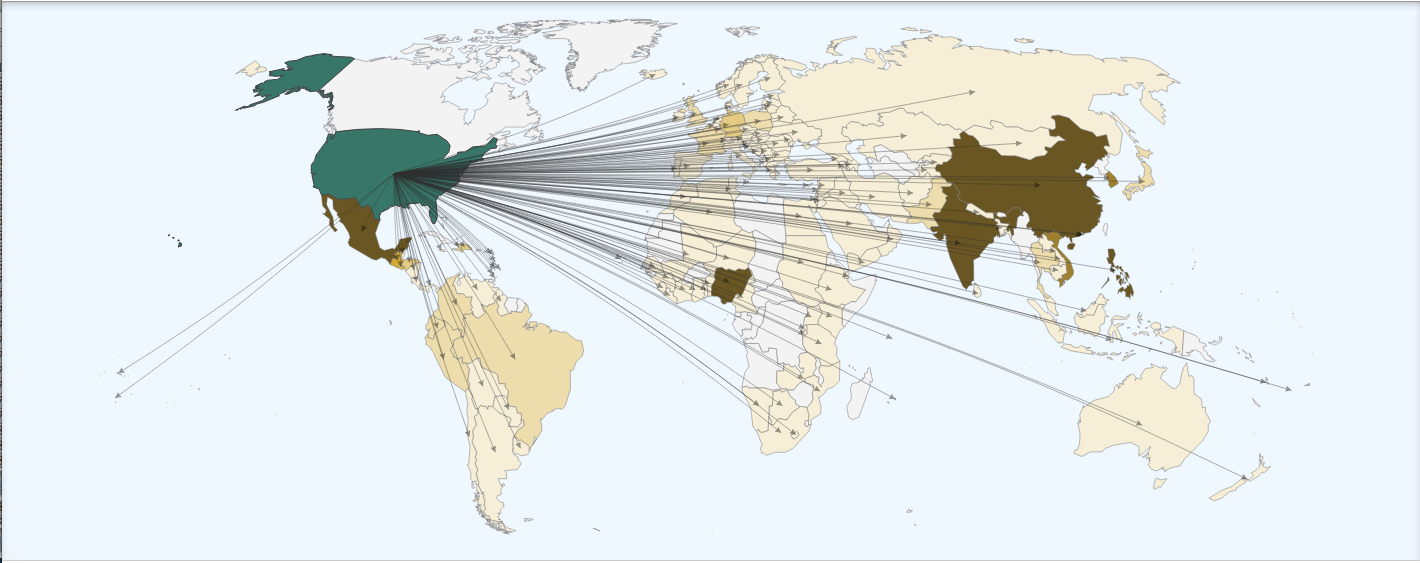
  1. Immigrants come from everywhere

    As noted above, since 1965, immigration to the United States has become a truly global phenomenon. It’s one thing to know that, but it’s another thing to see it in front of you.

  2. Remittances: the foreign aid program bigger than foreign aid

    Many immigrants send money back home — called remittances — either to help them save up and buy property to return to their home countries or to support family members who can’t come to the United States themselves. Immigrants officially sent $51 billion in remittances home in 2012 — far larger than the US government’s foreign aid budget of $39 billion that year. This map shows that the countries that receive the most remittances aren’t always the countries with the most emigrants in the United States — they’re the poorest countries with large US-emigrant populations.

  3. The hidden diversity of America’s immigrants

    The stereotypical face of immigration to America in 2015 is a Latino one. Americans routinely overestimate how many Latinos are immigrants, and particularly how many are unauthorized immigrants. And it’s true that Latin American countries send more immigrants to the United States than other regions. Because of that, it’s sometimes necessary to dig a little deeper to see how diverse the immigrant population really is. If this map of New York showed the most popular non-English language in each neighborhood, it would likely be monotonous. But by showing the most popular language that isn’t English or Spanish, it shows that New York is still a quilt of dozens of different immigrant communities.

  4. The twin cities of El Paso and Ciudad Juarez

    El Paso and Ciudad Juarez might be the world’s strangest twin city. The separation of the US border helps create vastly different environments in the two cities: El Paso is far more affluent than its Mexican twin; Juarez is a global crime capital, while El Paso has long been one of the safest cities in the United States. But they’re undoubtedly two halves of the same metropolitan area. In 2011, 14,000 people crossed one footbridge between the two cities on a daily basis. This colorized NASA photo shows buildings in gray and vegetation in red. The band of vegetation in the lower right of the photo might be the first thing you notice: evidence of a visible barrier separating Mexicans and Americans. But in the heart of the city, in the center of the photo, it takes tracing the Rio Grande to tell where Mexico ends and America begins.

By Dara Lind on June 10, 2015

Two teachers have harnessed the power of the sun — and provided an insanely cool science lesson in the process.

Charles Dazzo and Gerard D’Ambrosio serve as the mentors of the Green Tech Team at Staten Island’s Tottenville High School, which built a solar-powered car that scored second place in a national competition last year.

“I’m a firm believer that education — hands-on education — really works very well,” said Dazzo, 64, a social studies teacher.

That’s especially true when the hands-on lesson involves building a futuristic ride that looks like a speedboat on wheels.

Last year, they came close to winning it all at the Solar Car Challenge in Texas. This year, the team of eight kids will enter again, with what they hope is an even faster and more efficient car — one that looks like it came straight out of “The Jetsons.”

heroes16n-2-web

While last year’s solar speedster was just a frame, the new one has a sleek, carbon-fiber body, complete with “Solar Pirates” emblazoned on the front bumper. It can travel more than 300 miles on a single charge and reach speeds above 70 mph.

Watch video:  http://nydn.us/1kug0Cm

“It’s a beautiful looking machine,” Dazzo said.

D’Ambrosio, 47, an automotive technology teacher, said seeing the students’ finished product on the racetrack is one of the most rewarding aspects of his job.

“The competition for me, is one of the greatest things,” said D’Ambrosio, of New Jersey. “And working with all the kids has been a pleasure.”

Dazzo, who handles fundraising for the after-school program that has about 20 participants, added that Tottenville High is the only city school represented at the elite competition.

heroes

“We’re very proud to represent New York City,” said Dazzo, who lives in the Prince’s Bay neighborhood of Staten Island.

For teaching students mechanical, environmental and engineering skills, along with the joy of competition, D’Ambrosio and Dazzo have been nominated for Daily News Hometown Hero in Education awards.

D’Ambrosio, who provides guidance on how to build the car, said several former students have pursued degrees in environmental engineering.


* BY  NEW YORK DAILY NEWS: Tuesday, July 15, 2014

Coming out of the USSR could be a disorienting experience, as then- Graduate Student Extreme found out in 1979 after seven months here as a guide-interpreter on a cultural exhibit: in my first encounter with an automatic bank teller back in the States, the newfangled “ATM” took my card, scanned it and then asked if I wanted to continue our transaction (a) in English or (b) en español. What? In Spanish?!?

1

Who would choose a Spanish option in suburban Washington, DC? Had Zorro taken over the neighborhood? After the prolonged suspended animation of Soviet life, it was hard to resist an Extreme impulse to to look defiantly into the camera of this big-brotherish machine and ask, “Are you KIDDING, amigo?”

2 3.1

Flash forward a decade to 1989, when Instructor Extreme is showing the first group of Soviet high-school exchange students a popular U.S. film, “Ferris Bueller’s Day Off” (1986), as part of their orientation: the hero drives an expensive sports car into a Chicago parking garage, where he asks the smiling but non-responsive attendant, “Do you speak English?” – only to receive the taken-aback reply “What country do you think this is?”

This gets a big laugh from the young Russians, just as it had in theaters around the States. It’s America, so people speak English, of course – always have, always will.

SAMSUNG DIGIMAX A503

Wrong and wrong, it so happens. If in 1979 and 1989 there was still little doubt about Anglo-hegemony, by 1999 the party was over for a homogeneous English-only national culture – and the new millennium has seen this transformation quicken its pace.

4

Spanish was spoken in the Americas long before English: the Columbus trip was a Spanish project, and was followed by many more Hispanic forays north and south in the New World. While the young United States emerged as an Anglophonemajority state, it did so without adopting an official language – and does not have one today.

5.1 5

It does have a new fastestgrowing segment of the population, however: today every sixth U.S. citizen is Hispanic, the census bureau tells us, and three decades from now non-Hispanic whites will be a minority – a situation utterly unthreatening to such utterly American icons as Bart Simpson, whose trademark exclamation is ¡Ay, caramba! (Oh gosh!/Wow!/etc.) and Arnold Schwarzenegger, whose Terminator famously wished usHasta la vista, baby! (See you later!), coining one of the most famous lines in Hollywood history.

6

In short, Spanish is the second most used language in the United States, spoken by some 45 million Hispanophones and six million language students, comprising the largest national Spanish-speaking community anywhere outside of Mexico. Little wonder that the 2000 U.S. presidential election saw both major candidates – the resolutely white bread/mayonnaise/Anglophone- gringos George W. Bush and Albert Gore – deliver campaign speeches in Spanish. Votes are where you find ‘em, señor.

7

So you are very likely to encounter Spanish and Spanish-speakers in American films, literature and on your trip to the United States – but your English textbooks haven’t factored this in yet, have they? “No problemo!” (which is actually popular pseudo-Spanish for no hay problema). Here’s Prof. Extremo’s Hispanic Starter Kit: The Top 10 Spanish Words/Phrases/Usages you’ll see/hear throughout the US – often occurring in otherwise exclusively English contexts:

Print

1. adios [ah-dee-OHS] – goodbye

2. amigo [uh-MEE-goh], amiga [uh- MEE-guh] – friend (masc., fem.)

3. barrio [BAHR-ee-oh] – neighborhood, usually a heavily Hispanic area

4. bueno [BWE-naw] – good, all right, OK; buenos días – good morning/day

5. Comprende? [kuhm-PREN-dey] – Understand? Got it?

6. gracias [GRAH-see-uhs] – thank you

7. hombre [OM-brey] – man, guy

8. nada [NAH-duh] – nothing, zilch; de nada – you’re welcome

9. por favor [PAWR fah-VAWR] – please

10. señor [seyn-YAWR], señora [seyn- YAWR-uh], señorita [seyn-yuh- REE-tuh] – Mr., Mrs., Miss/Ms.

Hundreds of Spanish words and phrases have become dual-language terms – which is why all of the above now turn up in English dictionaries – and both the total number and their “lexical share” of the general American dialogue are growing as you’d expect: at a pace that parallels that of the Hispanic population.

So get ready to rumba, hombre. Bart Simpson’s still ahead of you! 

Text by Mark H. Teeter at 11/03/2013

9

(Mark H. Teeter is an English teacher and translator based in Moscow)

Check this Link:

http://www.gap360.com/learning-spanish-in-peru

Here’s a selection of photos and videos you may have missed posted on UN social media accounts from around the UN system over the past few weeks and shared with our social media team. Thank you to all who contributed!

Fred Tissandier ‏@ftissandier 16h On vaccine trail with Kiaku. 22 km biking to deliver vaccines to children of Kizulu Sanzi #sud-Congo

Bicycles are used to deliver vaccines to children in Congo. Thanks to Fred Tissandier of GAVI Alliance for posting this photo on Instgram.

Peacekeepers from Jordan recently hosted a free medical clinic for 350 students in Liberia. Thanks to our UN Mission in Liberia (@UNMILNews) colleagues for posting this photo on their Twitter account.

A group of young graduates recently received their certificates after a training cycle on life skills for ‘out of school youth’ at a technical school for boys in Darfur. Thanks to the UN Mission in Darfur (UNAMID) for posting this and more on their Facebook page.

As part of Malala Day on July 12, UNICEF Africa tweeted this photo of young people in Democratic Republic of Congo standing up to support Malala’s fight for the right to education for all. Thanks to @UNICEFAfrica for posting this and more on their Twitter account.


Check out the highlights from the 51st Graduate Study Programme, one of UN’s flagship educational programmes, which took place in Geneva this summer on the theme of “Gender Equality and the Empowerment of Women.” Thanks to our colleagues in Geneva for posting this and more on their YouTube account.

UN Special Envoy on Youth Ahmad Alhendawi is scooting away at UN Headquarters! In his own words, this is part of what happens when young people get an office at the UN. Thanks to @AhmadAlhendawi for posting this and more on his Twitter account.

At the ECOSOC Humanitarian Fair in Geneva earlier this month, the UN Refugees Agency presented these prototype solar-powered shelters to the audience. Thanks to UNHCR United Kingdom (@UNHCRUK) for posting this and more on their Twitter account.

At the Economic and Social Council Humanitarian Fair in Geneva earlier this month, the UN Refugee Agency presented these prototype solar-powered shelters to the visitors. Thanks to UNHCR United Kingdom (@UNHCRUK) for posting this and more on their Twitter account.

Students at a technical school in Lebanon were taught the secrets of making pasta when a visting chef came to visit their Italian cuisine course recently. See more photos and read about the event here. Thanks to United Nations Interim Force in Lebanon (UNIFIL) for posting this and more on their website.

* UN, Jul 21, 2013

DHAKA, Bangladesh—Rescue workers Friday pulled a female garment worker from the rubble of Rana Plaza after more than 16 days buried alive—among the longest periods anyone has survived such an ordeal.

The eight-story building, which housed five garment factories, collapsed April 24, killing more than 1,000 people, one of the worst-ever factory accidents.

[SB10001424127887323744604578474731981792500]

Agence France-Presse/Getty ImagesBangladeshi rescuers retrieve garment worker Reshma Begum from the rubble of a collapsed building on May 10.

Long after hope of finding anyone alive had faded, army rescuers said they had broken through the mass of concrete and steel to a woman in her 20s.

She had fallen from the third floor into a Muslim prayer room into an air pocket in the basement, and remained alive by forcing a broken pipe up through a crack in the debris for ventilation, rescuers said.

Reshma Begum, who identified herself as a seamstress who worked on the third floor of Rana Plaza, had been banging the pipe against concrete to attract attention, after bulldozers had removed loose rubble that had been covering the area.

“I heard the sound and rushed towards the spot,” Abdur Razzaq, an army sergeant who was involved in the rescue, said in an interview. “I knelt down and heard a faint voice. ‘Sir, please help me,’ she cried.”

The rescue was broadcast live on national television. As she was lifted from the rubble, crowds that had gathered broke into cheers of “God is great!” Rescue workers wiped away tears.

image

“It’s a miraculous event,” Prime Minister Sheikh Hasina said after visiting Ms. Begum in the hospital and congratulating the rescue teams.

Ms. Begum told rescuers she was unhurt and had survived by scavenging for food and bottled water in the backpacks of dead colleagues. She had been buried for 16 days and about seven hours during one of the hottest times of the year in Bangladesh, with temperatures reaching 95 degrees (35 degrees Celsius) and 80% humidity.

Her hair and face were covered in dirt as she carried out, wearing a purple and pink salwar-kameeze, and her scalp was showing where she had apparently lost big clumps of hair.

Doctors who attended her at a nearby military hospital said she was suffering from dehydration but otherwise appeared to have no major injuries.

At the hospital, a woman who identified herself as Ayesha Begum said Reshma was her sister.

“We’ve been waiting outside the building for two weeks,” said Ayesha Begum, flanked by another woman who identified herself as Reshma’s aunt. “We’d given up hope. God has brought her back for the sake of her little son.”

Reshma Begum came from the northern district of Dinajpur, according to Ayesha Begum. She said her sister had come to Dhaka four years ago to work in a garment factory so as to become more independent.

Reshma recently had separated from her husband and was bringing up her 5-year-old son, working as a seamstress in the New Wave Bottoms factory in Rana Plaza, she said.

The crowds around the disaster site had thinned in recent days, but on Friday evening, families clutching photos of missing loved ones were once again thronging the area hoping to see their relatives brought out alive.

“God is merciful,” said Afsar Ali, who said he was looking for his daughter. “We still have hope.”

There has been controversy in Bangladesh over the pace of the rescue operations. Right after the disaster, the Bangladesh government turned down an offer of help from the U.N. Office for the Coordination of Humanitarian Affairs, a spokesman for the office said.

In the first few days, volunteers were heavily involved, some using their bare hands. People held up handwritten signs asking for donations of oxygen cylinders, drills and water bottles.

Some relatives of those missing, angered by the lack of heavy-lifting equipment, clashed with police at the site.

Later, the army, which now is coordinating efforts, moved in with bulldozers and other heavy machinery. They have defended the pace of the rescue efforts, saying they were careful not to go too quickly and kill possible survivors.

Maj. Gen. Hasan Suhrawardy, who is leading the army’s salvage operation, said the pace would now slow again, since Ms. Begum’s survival had raised hopes, however slight, that other survivors could be in the wreckage.

Bulldozers stopped plowing the debris for a few hours after Ms. Begum was discovered, before starting operations again gingerly under flashlights.

Briefing reporters at the building collapse site, Gen. Suhrawardy said: “Reshma is totally OK. She worked hard to keep herself alive. That is a very strong woman.”

The last known survivor before Friday was killed on April 28 by a fire set off inadvertently by rescuers who were trying to cut through to free her.

The tragedy has shocked Bangladesh and the world, putting pressure on the government and foreign brands to improve safety conditions in the country’s 5,000 factories.

Bangladesh is one of the world’s largest producers of garments, supplying major U.S. and European retailers. The industry produces some of the world’s cheapest clothes, paying workers monthly wage rates as low as $40, a quarter those of China’s.

The government this week has begun an inspection of the country’s factories. On Wednesday, the government forced 18 factories to shut while they carried out safety improvements, including three owned by the country’s largest exporter of garments.

There have been few instances of people surviving longer than 10 days after disasters like earthquakes, according to academic studies. In 2010, after the Haiti earthquake, a teenage girl was rescued 15 days after the disaster.

The United Nations, which coordinates disaster relief, normally calls of search and rescue operations after a week or so and shifts its focus to tending to survivors.

In the past 10 days, focus has shifted to recovering hundreds of bodies that lay under rubble. The death toll has jumped by about 100 each day since Saturday, as salvage workers found huge numbers of bodies on the ground floor and basement.

On Friday, the toll rose to 1,050 people.


By SYED ZAIN AL-MAHMOOD (May 10, 2013)

—Joe Lauria in New York contributed to this article. 

1 2 3 4 5 6 7 8 9 10 11 12 13 14

A 17-year-old Canadian girl died Sunday, days after she attempted suicide following two years of what her mother described as near-constant bullying by classmates.

167897-rehtaeh-parsons

In November 2011, when Rehtaeh Parsons was just 15, the Nova Scotia girl got extremely drunk after consuming vodka at a party. According to the girl’s mother, she was raped by four teenage boys, one of whom snapped a picture of Rehtaeh being assaulted, CBC News reported.

Ultimately, police said, there was not enough evidence to bring charges in connection with the girl's alleged rape. This image was taken from a Facebook page created by Parsons' mother called "Angel Rehtaeh." 

Ultimately, police said, there was not enough evidence to bring charges in connection with the girl’s alleged rape. This image was taken from a Facebook page created by Parsons’ mother called “Angel Rehtaeh.” 

That photo quickly circulated among Parsons’ classmates, sealing a fate as cruel as the crime her mother says she endured at the party. Many at her school branded her “a slut,” her mother said. 

“She was never left alone. She had to leave the community. Her friends turned against her. People harassed her. Boys she didn’t know started texting her and Facebooking her asking her to have sex with them. It just never stopped,” Leah Parsons told the CBC.

An image of Rehtaeh Parsons and her mother posted on Facebook. Parsons hung herself after being gang-raped and repeatedly bullied, her family said. 

An image of Rehtaeh Parsons and her mother posted on Facebook. Parsons hung herself after being gang-raped and repeatedly bullied, her family said. 

Ashamed and distraught, Parsons let a week pass before she told her mother what had happened. The Royal Canadian Mounted Police were eventually called, and although an investigation was launched into the incident, Parsons and her mother were told that there was not enough evidence to charge the boys.

“[The police] said that they would go talk to them and that [the boys] realized what they did was wrong, but [there was] nothing they could do, criminally,” Leah Parsons told the CBC radio program “Maritime Noon.” “It was a slap in the face.”

Meanwhile, at school and online, the taunting didn’t stop, and eventually the family moved from Cole Harbour to Halifax.

A photo of Parsons being assaulted spread among her classmates, prompting taunting, her family says. 

A photo of Parsons being assaulted spread among her classmates, prompting taunting, her family says. 

The trauma of what happened followed the girl, however, and Parsons was shadowed by what her mother called “depression and anger” over her being ostracized and bullied. Plagued by thoughts of suicide, Parsons checked herself into the hospital in March.

Just days after being released, Parsons tried hanging herself in the bathroom of her home last Thursday.

“By the time I broke into the bathroom it was too late,” Leah Parsons wrote on a Facebook page she started in tribute to her daughter. “My beautiful girl had hung herself and was rushed to the hospital where she remained on life support until last night.”

In a final wrenching decision, Rehtaeh’s mother removed her from life support on Sunday.

“She made my life complete,” Leah Parsons wrote. “When Rehtaeh was born I dedicated everything to her and promised her the world. Others in this world took that away from her.”


BY / NEW YORK DAILY NEWS, APRIL 9, 2013

If we do not make the difference between people who earn more than those who earn less, be reasonable. Then the economic world, businesses or jobs will be chaos, for most people, where injustice, selfishness, greed and arrogance is something considered normal executive.

Ratio Of Pay CEO vs. Average Worker

There should be a limit on earnings regardless one has several professional degrees or doctorates at Harvard.


CEO_pay_worker_pay_stocks_profits_minimum_wage

We pay fair wages to all workers, without exception, according to the cost of living in the country, where human dignity is quantified.

In this way we will have a better world, a more just and where justice, peace and social solidarity is normal.

la-fi-mo-us-ceo-pay-231-times-more-than-averag-001

Also make sure that the domestic market is positive. Be Sure that most people will have some money left over to use it to make purchases of various products or services. Otherwise only a small group will do it and many companies or businesses will have to close its doors.

See You.

CTsT

There’s a lot of debate about the job and economic prospects for the current generation of college graduates. The fact that student debt has ballooned so much only exacerbates the tension of whether graduates will be able to find good jobs in a timely manner.

Despite all this, the latest jobs report confirms that folks with a college degree (red line) have an unemployment rate far lower than those who don’t have one (blue line).

unemploymentcollegevsnocollege


That being said, it is nice to see that the unemployment rate for those without a college degree took a nice leg down in March, dropping from 7.9 percent to 7.6 percent. In this chart, we zoom in on the blue line above, and we made it a bar chart so you can clearly see the change each month.

unemploymentforthosewithoutcollegedegrees

As you can see, it’s been a good several months for the population that didn’t go to college, though the job prospects for this group lag significantly behind those of people who did graduate.


By Joe Weisenthal, Apr. 7, 2013, “Business Insider”


When Mort Zuckerman, the New York City real-estate and media mogul, lavished $200 million on Columbia University in December to endow the Mortimer B. Zuckerman Mind Brain Behavior Institute, he did so with fanfare suitable to the occasion: the press conference was attended by two Nobel laureates, the president of the university, the mayor, and journalists from some of New York’s major media outlets.

6f7b288abf6ed85d94c3a4895eb7d_h338_w600_m6_lfalse


Many of the 12 other individual charitable gifts that topped $100 million in the U.S. last year were showered with similar attention: $150 million from Carl Icahn to the Mount Sinai School of Medicine, $125 million from Phil Knight to the Oregon Health & Science University, and $300 million from Paul Allen to the Allen Institute for Brain Science in Seattle, among them. If you scanned the press releases, or drove past the many university buildings, symphony halls, institutes, and stadiums named for their benefactors, or for that matter read the histories of grand giving by the Rockefellers, Carnegies, Stanfords, and Dukes, you would be forgiven for thinking that the story of charity in this country is a story of epic generosity on the part of the American rich.

generosity

It is not. One of the most surprising, and perhaps confounding, facts of charity in America is that the people who can least afford to give are the ones who donate the greatest percentage of their income. In 2011, the wealthiest Americans—those with earnings in the top 20 percent—contributed on average 1.3 percent of their income to charity. By comparison, Americans at the base of the income pyramid—those in the bottom 20 percent—donated 3.2 percent of their income. The relative generosity of lower-income Americans is accentuated by the fact that, unlike middle-class and wealthy donors, most of them cannot take advantage of the charitable tax deduction, because they do not itemize deductions on their income-tax returns.

ricos-y_pobres_3 ricos-y-pobres-246x300

But why? Lower-income Americans are presumably no more intrinsically generous (or “prosocial,” as the sociologists say) than anyone else. However, some experts have speculated that the wealthy may be less generous—that the personal drive to accumulate wealth may be inconsistent with the idea of communal support. Last year, Paul Piff, a psychologist at UC Berkeley, published research that correlated wealth with an increase in unethical behavior: “While having money doesn’t necessarily make anybody anything,” Piff later told New York magazine, “the rich are way more likely to prioritize their own self-interests above the interests of other people.” They are, he continued, “more likely to exhibit characteristics that we would stereotypically associate with, say, assholes.” Colorful statements aside, Piff’s research on the giving habits of different social classes—while not directly refuting the asshole theory—suggests that other, more complex factors are at work. In a series of controlled experiments, lower-income people and people who identified themselves as being on a relatively low social rung were consistently more generous with limited goods than upper-class participants were. Notably, though, when both groups were exposed to a sympathy-eliciting video on child poverty, the compassion of the wealthier group began to rise, and the groups’ willingness to help others became almost identical.

Royal-smackdown

Last year, not one of the top 50 individual charitable gifts went to a social-service organization or to a charity that principally serves the poor and the dispossessed.

If Piff’s research suggests that exposure to need drives generous behavior, could it be that the isolation of wealthy Americans from those in need is a cause of their relative stinginess? Patrick Rooney, the associate dean at the Indiana University School of Philanthropy, told me that greater exposure to and identification with the challenges of meeting basic needs may create “higher empathy” among lower-income donors. His view is supported by a recent study by The Chronicle of Philanthropy, in which researchers analyzed giving habits across all American ZIP codes. Consistent with previous studies, they found that less affluent ZIP codes gave relatively more. Around Washington, D.C., for instance, middle- and lower-income neighborhoods, such as Suitland and Capitol Heights in Prince George’s County, Maryland, gave proportionally more than the tony neighborhoods of Bethesda, Maryland, and McLean, Virginia. But the researchers also found something else: differences in behavior among wealthy households, depending on the type of neighborhood they lived in. Wealthy people who lived in homogeneously affluent areas—areas where more than 40 percent of households earned at least $200,000 a year—were less generous than comparably wealthy people who lived in more socioeconomically diverse surroundings. It seems that insulation from people in need may dampen the charitable impulse.

millonario


Wealth affects not only how much money is given but to whom it is given. The poor tend to give to religious organizations and social-service charities, while the wealthy prefer to support colleges and universities, arts organizations, and museums. Of the 50 largest individual gifts to public charities in 2012, 34 went to educational institutions, the vast majority of them colleges and universities, like Harvard, Columbia, and Berkeley, that cater to the nation’s and the world’s elite. Museums and arts organizations such as the Metropolitan Museum of Art received nine of these major gifts, with the remaining donations spread among medical facilities and fashionable charities like the Central Park Conservancy. Not a single one of them went to a social-service organization or to a charity that principally serves the poor and the dispossessed. More gifts in this group went to elite prep schools (one, to the Hackley School in Tarrytown, New York) than to any of our nation’s largest social-service organizations, including United Way, the Salvation Army, and Feeding America (which got, among them, zero).

pobreza-riqueza

Underlying our charity system—and our tax code—is the premise that individuals will make better decisions regarding social investments than will our representative government. Other developed countries have a very different arrangement, with significantly higher individual tax rates and stronger social safety nets, and significantly lower charitable-contribution rates. We have always made a virtue of individual philanthropy, and Americans tend to see our large, independent charitable sector as crucial to our country’s public spirit. There is much to admire in our approach to charity, such as the social capital that is built by individual participation and volunteerism. But our charity system is also fundamentally regressive, and works in favor of the institutions of the elite. The pity is, most people still likely believe that, as Michael Bloomberg once said, “there’s a connection between being generous and being successful.” There is a connection, but probably not the one we have supposed.


By Ken Stern’s book, With Charity for All: Why Charities Are Failing and a Better Way to Give, was published in February 2013

The Times Higher Education World University Rankings 2012-2013 powered by Thomson Reuters are the only global university performance tables to judge world class universities across all of their core missions – teaching, research, knowledge transfer and international outlook. The top universities rankings employ 13 carefully calibrated performance indicators to provide the most comprehensive and balanced comparisons available, which are trusted by students, academics, university leaders, industry and governments.

Top universities by region

Top universities by subject


The World Reputation Rankings measure an increasingly vital element in the social-network age, say Phil Baty

Reputation is subjective, messy and nebulous, but it matters deeply in today’s competitive global higher education sector.

Research has shown that a university’s reputation is the top priority (over location or even salary) for academics moving jobs, and it is the number one consideration for internationally mobile students, above tuition fees and course content. 

It can also be key to attracting collaborative partnerships and funding from alumni, philanthropists and industry.

And although reputations once gained can often be stubbornly enduring, things can change quickly in an information-rich, multimedia and socially networked age. The stakes are high.

“The strength of a university’s brand both depends upon and feeds into the success of the institution itself,” writes David Copping, a senior associate at the London law firm Farrer & Co.

“If a university thrives, the value of its brand will increase, in turn creating a virtuous feedback loop as academics, students and funding are drawn in. But the reverse is also true: failures of compliance or strategy can tarnish and at worst destroy this key asset, trapping the institution in a downward spiral.”

Given the importance of what is at stake, the Times Higher Education World Reputation Rankings have quickly developed into a powerful and highly cited global benchmark of universities’ academic prestige – a trusted brand index. So it is essential that the research underpinning the rankings can bear the weight being placed on it.

This top 100 list is based on the world’s largest invitation-only survey of experienced, published academics, carried out by the polling company Ipsos MediaCT for our rankings data provider, Thomson Reuters.

Respondents are carefully selected to be statistically representative of their country and their specialist discipline, and are asked to name a small number of institutions based on their own expert, subject-specific experience and knowledge. So the list gives a representative and balanced view of the most prestigious academic institutions in the world.

The 2013 rankings are based on a staggering 16,639 survey responses. In the three short rounds of the annual survey thus far, almost 50,000 responses have been gathered from more than 150 countries.

The reputation rankings are based on nothing more than subjective judgement, but it is the judgement of experts. It is thanks to their expertise and engagement with this important exercise that we can bring you this trusted picture of the most reputable universities in the world.

* Phil Baty is the Times Higher Education World University Rankings editor 2013

Top North American universities 2012-13

Rank Institution Country / Region Overall scorechange criteria
1 California Institute of Technology United States
95.5
2 Stanford University United States
93.7
4 Harvard University United States
93.6
5 Massachusetts Institute of Technology United States
93.1
6 Princeton University United States
92.7
9 University of California, Berkeley United States
90.5
10 University of Chicago United States
90.4
11 Yale University United States
89.2
13 University of California, Los Angeles United States
87.7
14 Columbia University United States
87.0
15 University of Pennsylvania United States
86.6
16 Johns Hopkins University United States
85.6
18 Cornell University United States
83.3
19 Northwestern University United States
83.1
20 University of Michigan United States
82.6
21 University of Toronto Canada
82.2
22 Carnegie Mellon University United States
81.5
23 Duke University United States
81.2
24 University of Washington United States
79.9
25 Georgia Institute of Technology United States
78.8
25 University of Texas at Austin United States
78.8
30 University of British Columbia Canada
77.3
31 University of Wisconsin-Madison United States
76.9
33 University of Illinois at Urbana Champaign United States
75.8
34 McGill University Canada
75.7
35 University of California, Santa Barbara United States
75.6
38 University of California, San Diego United States
75.2
41 New York University United States
72.8
42 University of North Carolina at Chapel Hill United States
72.4
44 University of California, Davis United States
71.8
44 Washington University in St Louis United States
71.8
47 University of Minnesota United States
70.5
51 Brown University United States
68.9
53 Ohio State University United States
67.0
54 Boston University United States
66.8
56 University of Southern California United States
66.3
61 Pennsylvania State University United States
65.8
69 Purdue University United States
63.8
72 University of Massachusetts United States
62.9
75 Rice University United States
62.0
76 University of Pittsburgh United States
61.7
79 Emory University United States
61.3
84 University of Montreal Canada
59.8
87 Tufts University United States
59.1
88 McMaster University Canada
59.0
91 University of Colorado Boulder United States
58.7
94 University of Notre Dame United States
58.3
94 Michigan State University United States
58.3
96 University of California, Irvine United States
58.2
97 University of Maryland, College Park United States
57.9
98 University of Arizona United States
57.7
99 Rutgers, The State University of New Jersey United States
57.5
102 University of Rochester United States
57.2
104 Case Western Reserve University United States
56.9
106 Vanderbilt University United States
56.6
118 University of Virginia United States
55.0
121 University of Alberta Canada
54.7
122 University of California, Santa Cruz United States
54.5
122 University of Florida United States
54.5
124 Dartmouth College United States
54.4
134 University of Utah United States
53.2
134 Indiana University United States
53.2
148 Arizona State University United States
51.9
150 Boston College United States
51.6
154 University of California, Riverside United States
51.1
156 Yeshiva University United States
50.9
156 Texas A&M University United States
50.9
162 Stony Brook University United States
50.2
165 University of Delaware United States
49.7
167 University of Texas at Dallas United States
49.5
168 George Washington University United States
49.4
169 University of Iowa United States
49.3
171 University of Ottawa Canada
49.0
174 Georgetown University United States
48.9
174 Rensselaer Polytechnic Institute United States
48.9
184 William & Mary United States
48.0
184 Colorado School of Mines United States
48.0
184 University of Illinois at Chicago United States
48.0
189 Medical University of South Carolina United States
47.7
190 Wake Forest University United States
47.3
193 Iowa State University United States
46.9
193 University of Miami United States
46.9
196 University of Victoria Canada
46.7
198 University at Buffalo United States 46.6

Rankings methodology: experts recognise these as the best

The excellent response to the third round of the annual Academic Reputation Survey gives an even more accurate picture of scholarly opinion.


The 
Times Higher Education World Reputation Rankings are created using the world’s largest invitation-only survey of academic opinion – a truly unique piece of research.

The Academic Reputation Survey, available in 10 languages, uses United Nations data to ensure that it is-properly distributed to reflect the demographics of world scholarship.
It is also evenly spread across academic disciplines.

Those invited to take part are statistically representative of both their country and their discipline.

The questionnaire, administered by polling company Ipsos MediaCT for THE’s rankings data supplier Thomson Reuters, targets only experienced, published scholars, who offer their views on excellence in research and teaching within their disciplines and at institutions with which they are familiar.

The 2013 rankings are based on a survey carried out in March and April 2012, which received 16,639 responses from 144 countries. When polled, the respondents on average had been working in the academy for 17 years.

With 13,388 answers to the first Academic Reputation Survey in 2010 and a further 17,554 in 2011, just under 48,000 detailed expert responses from more than 150 countries have now been collected in just three annual rounds.

There is a balanced spread of responses across disciplines. In 2013, the most (22.1 per cent) have come from the social sciences, followed by engineering and technology (21.3 per cent), physical sciences (18.0 per cent), clinical subjects (15.4 per cent) and the life sciences (12.7 per cent), with the arts and humanities polling the lowest (10.5 per cent).

The spread across the regions is also well balanced: 33 per cent of responses hail from North America, 17 per cent from Western Europe, 12 per cent from East Asia, 10 per cent from Oceania, 6 per cent from Eastern Europe, 5 per cent from South America and 5 per cent from the Middle East.

In the survey, scholars are -questioned at the level of their specific subject discipline. They are not asked to create a ranking or to list a large range of institutions, but to name no more than 15 of those they believe to be the best, based on their own experience.

To help elicit more meaningful responses, respondents are asked “action-based” questions, such as: “Which university would you send your most talented graduates to for the best postgraduate supervision?”

The survey data were used alongside 11 objective indicators to help create the 2012-13 World University Rankings, which were unveiled in October last year. The reputation data are published alone each year to create the World Reputation Rankings.

Calculating the scores
The reputation table ranks institutions according to an overall measure of their esteem that combines data on their reputation for research and for teaching.

The two scores are combined at a ratio of 2:1, giving more weight to research because feedback from our expert advisers suggests that there is greater confidence in respondents’ ability to make accurate judgements about research quality.

The scores are based on the number of times an institution is cited by respondents as being the best in their field. The number one institution, Harvard University, was selected most often. The scores for all other institutions in the table are expressed as a percentage of Harvard’s, set at 100. For example, the University of Oxford received 73 per cent of the number of nominations that Harvard received, giving it a score of 73 against Harvard’s 100. This scoring system, which is different from the one used in the World University Rankings, is intended to provide a clearer and more meaningful perspective on the reputation data in isolation.

The top 100 universities by reputation are listed, but Times Higher Education has agreed with data supplier Thomson Reuters to rank only the top 50 because the differentials between institutions after that point become very narrow. The institutions that make up the second half of the table are listed in groups of 10, in alphabetical order. Scores are given to one decimal place, but were calculated to greater precision.

When Saul Escobar was punished for daring to speak his mother tongue inside a Ucayali school, it never occurred to him that one day he would be a professor in a university and would teach in Shipibo, the very language that had so exasperated the mestizo director of his school.

Graduación

Saul remembers that with a smile, the same smile that he flashed two decades ago when Gerardo Zerdin, then the parish priest in Atalaya, decided to support him so that he could receive a university education in Lima. “I want to study, but I don’t have money,” Saul had told him. Saul has come a long way since then; not only is he a professor at the Universidad Nopoki, but he is about to get his masters degree.

somos19012013-1

20130123125945TkqH

‘I have come’
Even though the idea had been bouncing around his head since the 1990s, it was only in 2005 that Zerdin, the bishop of San Ramón, with jurisdiction covering all of Peru’s central jungle, put his plan into motion. He approached the Monsignor Lino Panitza, the bishop of Carabayllo and founder of the Universidad Católica Sedes Sapientiae (UCSS), and asked him to help achieve his dream of creating an educational center for the indigenous population in Atalaya.

charla-fisio-1_thumb

Having lived with various ethnic groups in the Amazon, and especially with the Shipibo, Zerdin observed that the education in the classroom left a lot to be desired, as the teachers came from other parts of Peru, did not integrate into the communities, did not teach in the local languages and disappeared for long periods of time. So, he thought, the best thing would be if the locals themselves received an education, to later impart it to their communities. Lino Panitza, who shared the idea of providing opportunities for marginalized young people, was receptive, and that same year, an agreement was signed between the vicarship of San Román and the UCSS to create Nopoki (‘I have come’ in Asháninka).

“I don’t have words to express the greatness of Nopoki”
In 2012, four students belonging to the Yine culture graduated from Nopoki with bachelor’s degrees. It was hard work for Remigio Zapata, in charge of Yine grammar and tasked with reviewing all of the daily lessons that the students received in that language. “The course that was hardest for me was math, in part because of the insufficient prior education, but also because words like tangent, parallel and vertical are untranslatable into Yine,” he says.

20130123125944xMiv

Juan López, also a professor at Nopoki, had to live up to his Yánesha name, Oth, which means “the strongest, the most powerful,” in order to overcome all of the challenges that life has presented him. When he was an important Yánesha leader, he was kidnapped for fifteen days by Shining Path; he studied at the La Cantuta University until Fujimori closed it and he had to flee to Pucallpa to continue his studies; later, he was elected mayor of the district of Palcazú, and when he refused a bribe from narcotraffickers, they put a price on his head. He had to leave Peru, assisted by German NGOs. In 2004, he returned to his community in the central jungle to work as a primary school teacher. Now, in Nopoki, he feels fulfilled. “Here, the students have food, a bed, sanitary facilities, clothes, healthcare, and that’s priceless. Education is the key to development, and the graduates of Nopoki have a complete education; they aren’t just teachers, but rather can create electrical, water and sewage systems. I don’t have words to express the greatness of Nopoki. If I’d had this opportunity, I would be an ambassador or a cabinet minister,” says Juan.

In 2006, Nopoki started as a pre-university center. The communities were very enthusiastic about the project. Roughly sixty students arrived and prepared themselves while UCSS was creating a bilingual, bicultural program. In 2007, there was an entrance exam, and the spectrum of participating indigenous nations expanded significantly. By then, professors from UCSS were already teaching, but they did not have the campus they now occupy. All of the activities were carried out in the Atalaya parish house. The rooms held up to 20 students on cots.

imagen (1)nopoki_u6nopoki_u8

In 2008, they received 30 hectares for the campus. The students cleared the land themselves and later helped to build the university. In 2010, they moved to the campus. In 2011, the first class of 26 students graduated with bachelors degrees. In December of 2012, 33 young indigenous students graduated, and they are now at the UCSS campus in Lima to receive their licenses.

Today, the administration of Nopoki is shared. The payroll is the responsibility of UCSS, and the expenses for housing the students and construction are billed to the vicarship. Help from international NGOs and private donations have been important in making the project a reality.

39091917

‘He awoke our hearts’
Jovita Vasqúez, a 33-year-old Shipibo-Conibo from the first graduating class, is already a councilwoman in the Atalaya provincial government. She had always wanted to make something of herself, but it was impossible for her to finish her studies in Pucallpa due to a lack of funds. In her community, located in the district of Tahuanía, they spoke of Monsignor Zerdin as a legendary figure who helped the Shipibo. She let him know that she was interested in studying. That’s how she was considered for inclusion in Nopoki. “I learned to value my culture. The monsignor awoke our hearts and fed our self-esteem,” says a grateful Jovita.

Diógenes Campos, a 23-year-old Asháninka, is in the second entering class and lives in the indigenous community Aerija. From 2008 to 2010, he lived at Nopoki, but that he has a wife and son, he lives in his community and walks an hour each way to the university. In the future, he wants to work as a teacher in his community and to promote the development of agriculture, tourism, handicraft production and health. Unlike earlier generations, Diógenes believes in family planning and only wants to have two children. That is just one of the cultural changes he wants to inspire among his compatriots.

3909178639091969

A simple act of justice
The vice rector of UCSS, Dr. Gianbatista Bolis, was surprised by the ability of the indigenous students to pick apart the poems of Rilke, Pavese and Leopardi and associate them with their own experiences. This reinforces an important theory in intercultural anthropology, posited by Alain Touraine, which holds that all languages are dialects of one fundamental language, which is the language of the heart of man.

What’s certain is that a project like Nopoki could not be carried out without the belief that all human beings have the same potential and greatness. There are people with few opportunities, not fewer capacities. Giving them the tools to chart their own destiny is a simple act of justice.

imagen


imagen

The natives graduated in the municipal coliseum of Atalaya, under the rain but illuminated by knowledge. Soon, they would leave to study for their licenses in Lima. As if by ritual, they would water, and take their photos next to, an aguaje palm tree that the first class had planted on the UCSS campus in Los Olivos. The palm tree has grown, and so have they.


* Álvaro Rocha for Somos,Translated and adapted by Nick Rosen (January 23, 2013)

Thinking in another language changes how people weigh their options.

The study of how people process foreign languages has traditionally focused on the topics we wrestled with in high school French or Spanish classes — botched grammar, misunderstood vocabulary, and mangled phonemes. But in recent years psychologists have gone to the laboratory with a phenomenon that historically was only discussed in memoirs by bilingual writers like Vladimir Nabokov and Eva Hoffman: a foreign language feels less emotional than the mother tongue. Consider the case of taboo words. For many multilinguals, swearing in a foreign languagedoesn’t evoke the same anxiety (or bring the same emotional release) as using a native language. Decreased emotionality in a foreign language spans the gamut of emotions, from saying “I love you,” to hearing childhood reprimands, to uttering morally grave lies, or being influenced bypersuasive messages in advertising.

Researchers have sought to understand the range and limits of these emotional language effects. Lower proficiency and/or late acquisition of the foreign language seems to be a crucial constraint. For people whogrew up bilingual, skin conductance responses and self-reports were similar when listening to emotional phrases in either language. One method for finding new types of emotional-language effects is to examine areas where cognitive neuroscience reports that people can switch between analytical processing and emotional processing. Gut, automatic or instinctive reasoning is grounded in an emotional good-bad response. Alternatively, reasoning can be the result of a deliberative process that involves careful, logical analysis. Would bilinguals be more analytical and less emotional when making decisions in a foreign language?

Boaz Keysar, Sayuri Hayakawa, and Sun Gyu An of University of Chicago asked this question in a paper recently published in Psychological Science. They studied framing effects, a phenonmenon investigated by Daniel Kahneman and others. When a decision is verbally framed as involving a gain, humans prefer a sure outcome over a probabilistic outcome. When the same situation is framed as involving losses, people sometimes prefer to gamble. For example, given a scenario involving 600 sick individuals and two types of medicines to administer, research participants prefer the medicine which will save 200 people for sure, rather than the medicine which has a 1/3 chance of saving all 600 sick people and a 2/3 chance of saving no one. If the formally identical illness scenario is provided, but framed in terms of how many people will die, then research participants are more likely to choose the probabilistic option. Framing effects are one of the classic examples of how humans deviate from logical reasoning, and indeed, individuals with a propensity for logical reasoning, such as those with Asperger Syndrome, are less influenced by the verbal frame when making these types of decisions.

The Chicago researchers randomly assigned bilinguals to read and respond to decision-making scenarios using either their native or foreign language. Similar versions of the study were conducted in the U. S, France and Korea.  This was important because a foreign language may feel more emotional when it is the language of daily life, as happens when studying at a foreign university. English was the first language for the U. S. participants and the foreign language for Korean participants. In France, English was the native language and the French was the foreign language but also language of immersion. Data from all three locations were consistent: the standard framing effects were found for the native language and were absent in the foreign language. The implication is that people were less influenced by emotional aspects of the scenarios when reading scenarios in their foreign language. This is an impressive finding since one might have supposed that the stress of using a less proficient language would diminish the cognitive resources needed for deliberative reasoning, thus pushing people to make gut, instinctive or emotional responses.

The authors ran additional experiments using a paradigm called loss aversion, another case where emotion can influence decision making. People are reluctant to accept bets that involve a chance of losing money, even if the odds are in the favor of winning, such as a 50 percent chance of winning $12 vs. losing $10. Keysar and colleagues found that, regardless of whether the bilinguals played with hypothetical money or real cash that could be kept after the experiment ended, bilinguals accepted the positive bets more often when they played using their foreign language and more often resisted betting when using their native language. This confirmed the finding of being reasoning more logically when using a foreign language.

Language has been traditionally viewed as a vehicle for communicating information (indeed, Chomsky famously characterized language as a mental algebra). Researchers have assumed that, as along as people are proficient enough, then how they respond will not be affected by the language they are using. It is now becoming better appreciated that people answer surveys differently depending on the language. For example, Chinese international students studying in North America agreed with traditional Chinese values more when answering a survey in Chinese; they had higher self-esteem scores when completing a self-esteem questionnaire in English. The full extent of these effects of languages on responses are still being investigated.

Like the other emotional-language effects discussed above, Keysar’s study on how language influences decision making are laboratory effects. Is this what happens outside the lab? Psychologists are increasingly advising foreigners in the US to seek psychotherapy with a bilingual counselor, and, to minimize missing nuances or emotional implications, to avoid conducting life-or-death conversations in a foreign language, such as a serious talk with a doctor, taking a polygraph test, or undergoing police interrogation. But in the decision making case studied by the Chicago team, use of a foreign language led to more logical and better decisions. Does this imply that bilinguals should routinely seek to use their foreign languages when making decisions? Should they buy a house or plan their retirement using a foreign language? An ethnographic approach could analyze cases where individuals end up using their native or a foreign language to conduct business. A wide range of laboratory and/or field experiments should be conducted in order to determine if the elimination of framing effects is a cute laboratory finding or something that may influence real life.

Are you a scientist who specializes in neuroscience, cognitive science, or psychology? And have you read a recent peer-reviewed paper that you would like to write about? Please send suggestions to Mind Matters editor Gareth Cook, a Pulitzer prize-winning journalist at the Boston Globe. He can be reached at garethideas AT gmail.com or Twitter @garethideas.


ABOUT THE AUTHOR(S)

Catherine Caldwell-Harris, Associate Professor of Psychology at Boston University, received her Ph.D. in Cognitive Science and Psychology from the University of California, San Diego. Trained in psycholinguistics and cognitive science, she has conducted research on a wide variety of topics, including language processing, cross-cultural psychology and individual differences in cognitive styles.


 Glauco Machado’s plans for his future were not working out the way he had hoped. It was 1996, and he was an undergraduate in São Paulo, Brazil. He knew he wanted to be a biologist and to study amphibians with a professor who specialized in their behavior. Then the professor died in a car crash.

An adviser was essential to starting a research career, but no one else at his university worked on amphibians. He was bereft. For a field biologist studying behavior, the animals that are the subjects of study may turn out to be lifelong companions. The young biologist had already given up on tortoises, his first love, because there were none nearby. Now amphibians were out. What was he to do?

A friend and fellow biology student reminded him that his real interest was in studying behavior, not a specific animal, and told him about a cave with large numbers of a relatively unstudied order of arachnids (spiders, ticks, mites and other creatures that people commonly call insects, but are not), easily observed, with a wide range of behaviors. The creatures in question were harvestmen; the most familiar North American member is the daddy longlegs.

As Dr. Machado, now head of the Laboratory of Arthropod Behavior and Evolution at the University of São Paulo, recalled recently, he had never heard of this group, but he was intrigued enough to go to the cave, where he encountered one small problem. “I am a little arachnophobic,” he said, “a little bit.” And “there were huge spiders inside the cave.”

For a moment he hesitated, but the harvestmen drew his gaze, some of them gathered in tangled groups of spindly legs and small bodies, others guarding nests of eggs. “They were amazing,” he said. In three months he had enough information to persuade an ant specialist at the university to advise him, and to publish his first scientific paper; he had found his life’s work.

“It was,” he said, “completely accidental.”

Now, a decade and a half later, Dr. Machado is one of the foremost experts on the creatures he first saw in the cave. He was at the annual meeting of the Animal Behavior Society here this month to describe the extraordinary amount of care that males in some varieties of harvestmen take of nests and eggs, and how he and his colleagues had experimentally demonstrated the reason. Within those groups, the nest-guarding males attracted more females and had more opportunities to copulate.

He was an editor of the definitive work on the creatures, and the research he and colleagues in his lab have done is drawing the attention of other scientists to a once obscure group.

This kind of career is often recounted by field biologists, an accidental start leading to a lifelong passion for an animal others might ignore. Although the framework of science may seem hyper-rational, some decisions are more like choosing a spouse than designing an experiment, with room for serendipity and accident.

The childhood of the biologist Edward O. Wilson offers one of the best-known tales of turning an accident to good use. Dr. Wilson, among his many other achievements, is a world authority on ants. He is an author, with Berth Holldobler of “The Ants,” the definitive tome on this subject, which won a Pulitzer Prize in 1991, a rare achievement for a book of serious science.

But birds were his first love. He lost the sight in one eye in a childhood accident, and with it the depth perception needed to pick birds out in the forest leaves. He turned instead to close observation of the forest floor, and ants. He wrote in his autobiography, “Naturalist,” that “most children go through a bug phase. I just never grew out of it.”

Some passions are easily understood. Jane Goodall loves chimpanzees, which she described as, “next to Homo sapiens, the most fascinating and complex in the world today.” Elephants, lions, wolves and ravens have caused scientists to fall in love with them as well as study them.

Other loves are more difficult for people outside of the field to grasp. Mark Siddall at the American Museum of Natural History is a great fan of the animals he studies — leeches. He told The New York Times in an article a few years ago that as a child, he hated leeches. They would attach themselves to him while he was swimming. Now he collects them all over the world.

It may be that field scientists, in their professional lives, learn to love the one they’re with, so to speak, or the one that will interest an adviser, and get a grant. Certainly, scientists are not trained to pick the animal that they love to study. And there is no rule that they have to stick with one animal, even if that often happens.

I asked Marlene Zuk, a professor in the department of ecology, evolution and behavior at the University of Minnesota, who wrote a book about insects, “Sex on Six Legs,” whether she had stayed with insects, or one variety of insect.

She said that she had studied several animals, including red jungle fowl, the ancestor of chickens, and had a strong interest in birds as well as insects, but that crickets had been her main focus for many years. She said that graduate students in animal behavior are encouraged to think of what question they want to ask, not what animal they want to study. If a romance ensues, well, scientists are human.

And when passionate connections are formed, they can be contagious. She said in an e-mail that because of the work of Dr. Machado and his lab, “I have developed a huge love of harvestmen.”

Dr. Zuk said that insects have a strong appeal to her partly because they are so different from people that it is hard to anthropomorphize them. She has stuck with crickets, she says, because “I keep finding out interesting things with them, some of them serendipitously. Also, I wanted an animal that had a sexual signal that was easy to analyze, and one that got parasites.”

“But,” she added, “I do really like them, also.”


* By , NYT,—June 25, 2012

Arguing against immigration policies that force foreign-born innovators to leave the United States, a new study to be released on Tuesday shows that foreign nationals played a role in more than three out of four patents at the nation’s top research universities.

Conducted by the Partnership for a New American Economy, a nonprofit group co-founded by Mayor Michael Bloomberg of New York, the study notes that nearly all the patents were in science, technology, engineering and math, the so-called STEM fields that are a crucial driver of job growth.

The report points out that while many of the world’s top foreign-born innovators are trained at United States universities, after graduation they face “daunting or insurmountable immigration hurdles that force them to leave and bring their talents elsewhere.”

The Partnership for a New American Economy released a paper in May saying that other nations were aggressively courting highly skilled citizens who had settled in the United States, urging them to return to their home countries. The partnership supports legislation that would make it easier for foreign-born STEM graduates and entrepreneurs to stay in the United States.

“Now that we know immigrants are behind more than three of every four patents from leading universities, the federal laws that send so many of them back to their home countries look even more patently wrong,” Mayor Bloomberg said in a statement.

But some worry that the partnership’s ideas for immigration reform would undermine similarly skilled American workers while failing to address broader problems with immigration policy.

“No one is asking what is in their best interest, the American worker,” said Eric Ruark, director of research for the Federal for American Immigration Reform, an advocacy group that is pushing for reduced immigration. “It’s what is best for the employers. What is best for the foreign workers. It’s not as if the foreign workers aren’t skilled. What’s being ignored is we already have a domestic work force that has the same skills.”

The most recent study seeks to quantify the potential costs of immigration policies by reviewing 1,469 patents from the 10 universities and university systems that had obtained the most in 2011. The schools include the University of California system, Stanford and the Massachusetts Institute of Technology.

Patents, the study maintains, are a gauge for a nation’s level of innovation and an important way for the United States to maintain an edge in STEM fields.

In one illustration of the issue, the study notes that nine out of 10 patents at the University of Illinois system in 2011 had at least one foreign-born inventor. Of those, 64 percent had a foreign inventor who was not yet a professor but rather a student, researcher or postdoctoral fellow, a group more likely to face immigration problems.

Some of the patents that were reviewed for the report have become business ventures. Wenyuan Shi, a professor at the University of California, Los Angeles, earned a patent for an ingredient in a lollipop he developed that works as a dental treatment for children. A native of China, Mr. Shi has created a company to commercialize his inventions.

But current immigration laws can make it difficult for foreign-born students to remain in the United States after graduation. And employers may be wary of hiring them because green cards, allowing for permanent residency status, are limited and the process of obtaining one is cumbersome and expensive.

Under the current system, foreign-born students are allowed to stay in the United States for 12 to 29 months after graduation, provided they find a job or internship in their field.

After that, more permanent visas are difficult to obtain, restricted by factors like country quotas. The study notes that China is entitled to the same number of visas as Iceland.

Dr. Ashlesh Murthy came to the United States from India in 2001 to pursue a master’s degree in molecular biology at the University of Texas at San Antonio. Working with his professors there, he developed a vaccine for the sexually transmitted disease chlamydia, which obtained patents in 2011 and 2012.

Nonetheless, Dr. Murthy had to negotiate a bureaucratic maze to remain in the United States, and at one point was stuck in India for an extra month because American officials in India doubted a previously approved visa.

Noting that university officials petitioned a congressman to intervene on his behalf, Dr. Murthy, said, “If I was not in a position where they really wanted me, I seriously doubt I would have gotten back.”

* By , NYT, June 25, 2012

A Pennsylvania first-grader who doesn’t have hands won a trophy and $1,000 in a penmanship competition. 

On Wednesday, Annie Clark, 7, became the first recipient of the Nicholas Maxim Award, a prize from educational publisher Zaner-Bloser Inc. that recognizes disabled students with exceptional handwriting. 


Annie, who writes by wedging a pencil between her two arms, accepted the award from the basketball court at Wilson Christian Academy. She was cheered on by students and faculty as she wore all yellow in honor of the school’s colors. 

“Annie has always been very, very determined, very self-sufficient in dressing herself and feeding herself,” her dad Tom told the Pittsburgh Post-Gazette. “She can ride a bike. She swims. She is just determined that there’s nothing she can’t do.” 

Born to a family of nine children, Annie is a sister to five other siblings adopted from China. Most of Annie’s siblings – including children born biologically to her parents – also have disabilities.


* DAHVI SHIRA, Friday April 20, 2012

Next Page »